TRAC Adds Asylum Reports on Nearly 100 New Immigration Judges
Published Nov 8, 2023
TRAC released its latest series of Immigration Judge reports, updated with asylum grant and denial rates by individual Judges through the end of FY 2023 (September 2023). These annual reports examine asylum decisions for individual Immigration Judges in each of the 64 current immigration courts.[1]
TRAC has been producing this annual series for many years. All reports in this series, including earlier editions, are available online. The earliest TRAC reports covered Immigration Judge asylum decisions dating back to FY 1994. The Court was smaller then with 193 individual Judges included in the series. The most recent coverage has grown to 732 reports.[2] The latest FY 2023 judge-by-judge asylum decision reports are available here.
TRAC’s reports this year have added a record number of Judges who are new to this series. Typically new reports are for recently appointed judges although, as discussed below, it is relatively unusual for a judge to make the list in their first year. All told, 13 percent of the judges in TRAC’s latest reports are judges that were newly added to the series.[3]
Each Judge report is unique to that Judge’s work in a specific Court in order to facilitate comparisons among colleagues on the same bench and to avoid unfair comparisons to Judges in different Courts that may also have very different case compositions. When cases are randomly assigned to Judges based in the same Court, each Judge should have a roughly similar composition of cases given a sufficient number of asylum decisions.[4] It is for this reason that TRAC only publishes a report once a judge grants or denies at least 100 asylum applications. This minimizes possible natural variation in the merits of cases heard. To aid in meaningful comparisons, reports include some details on the composition of cases a judge hears.
This rest of this report focuses on those judges who, for the first time, met the criteria of deciding at least 100 asylum cases in the six-year period ending FY 2023.
Where Judges with First-Time Reports Were Based
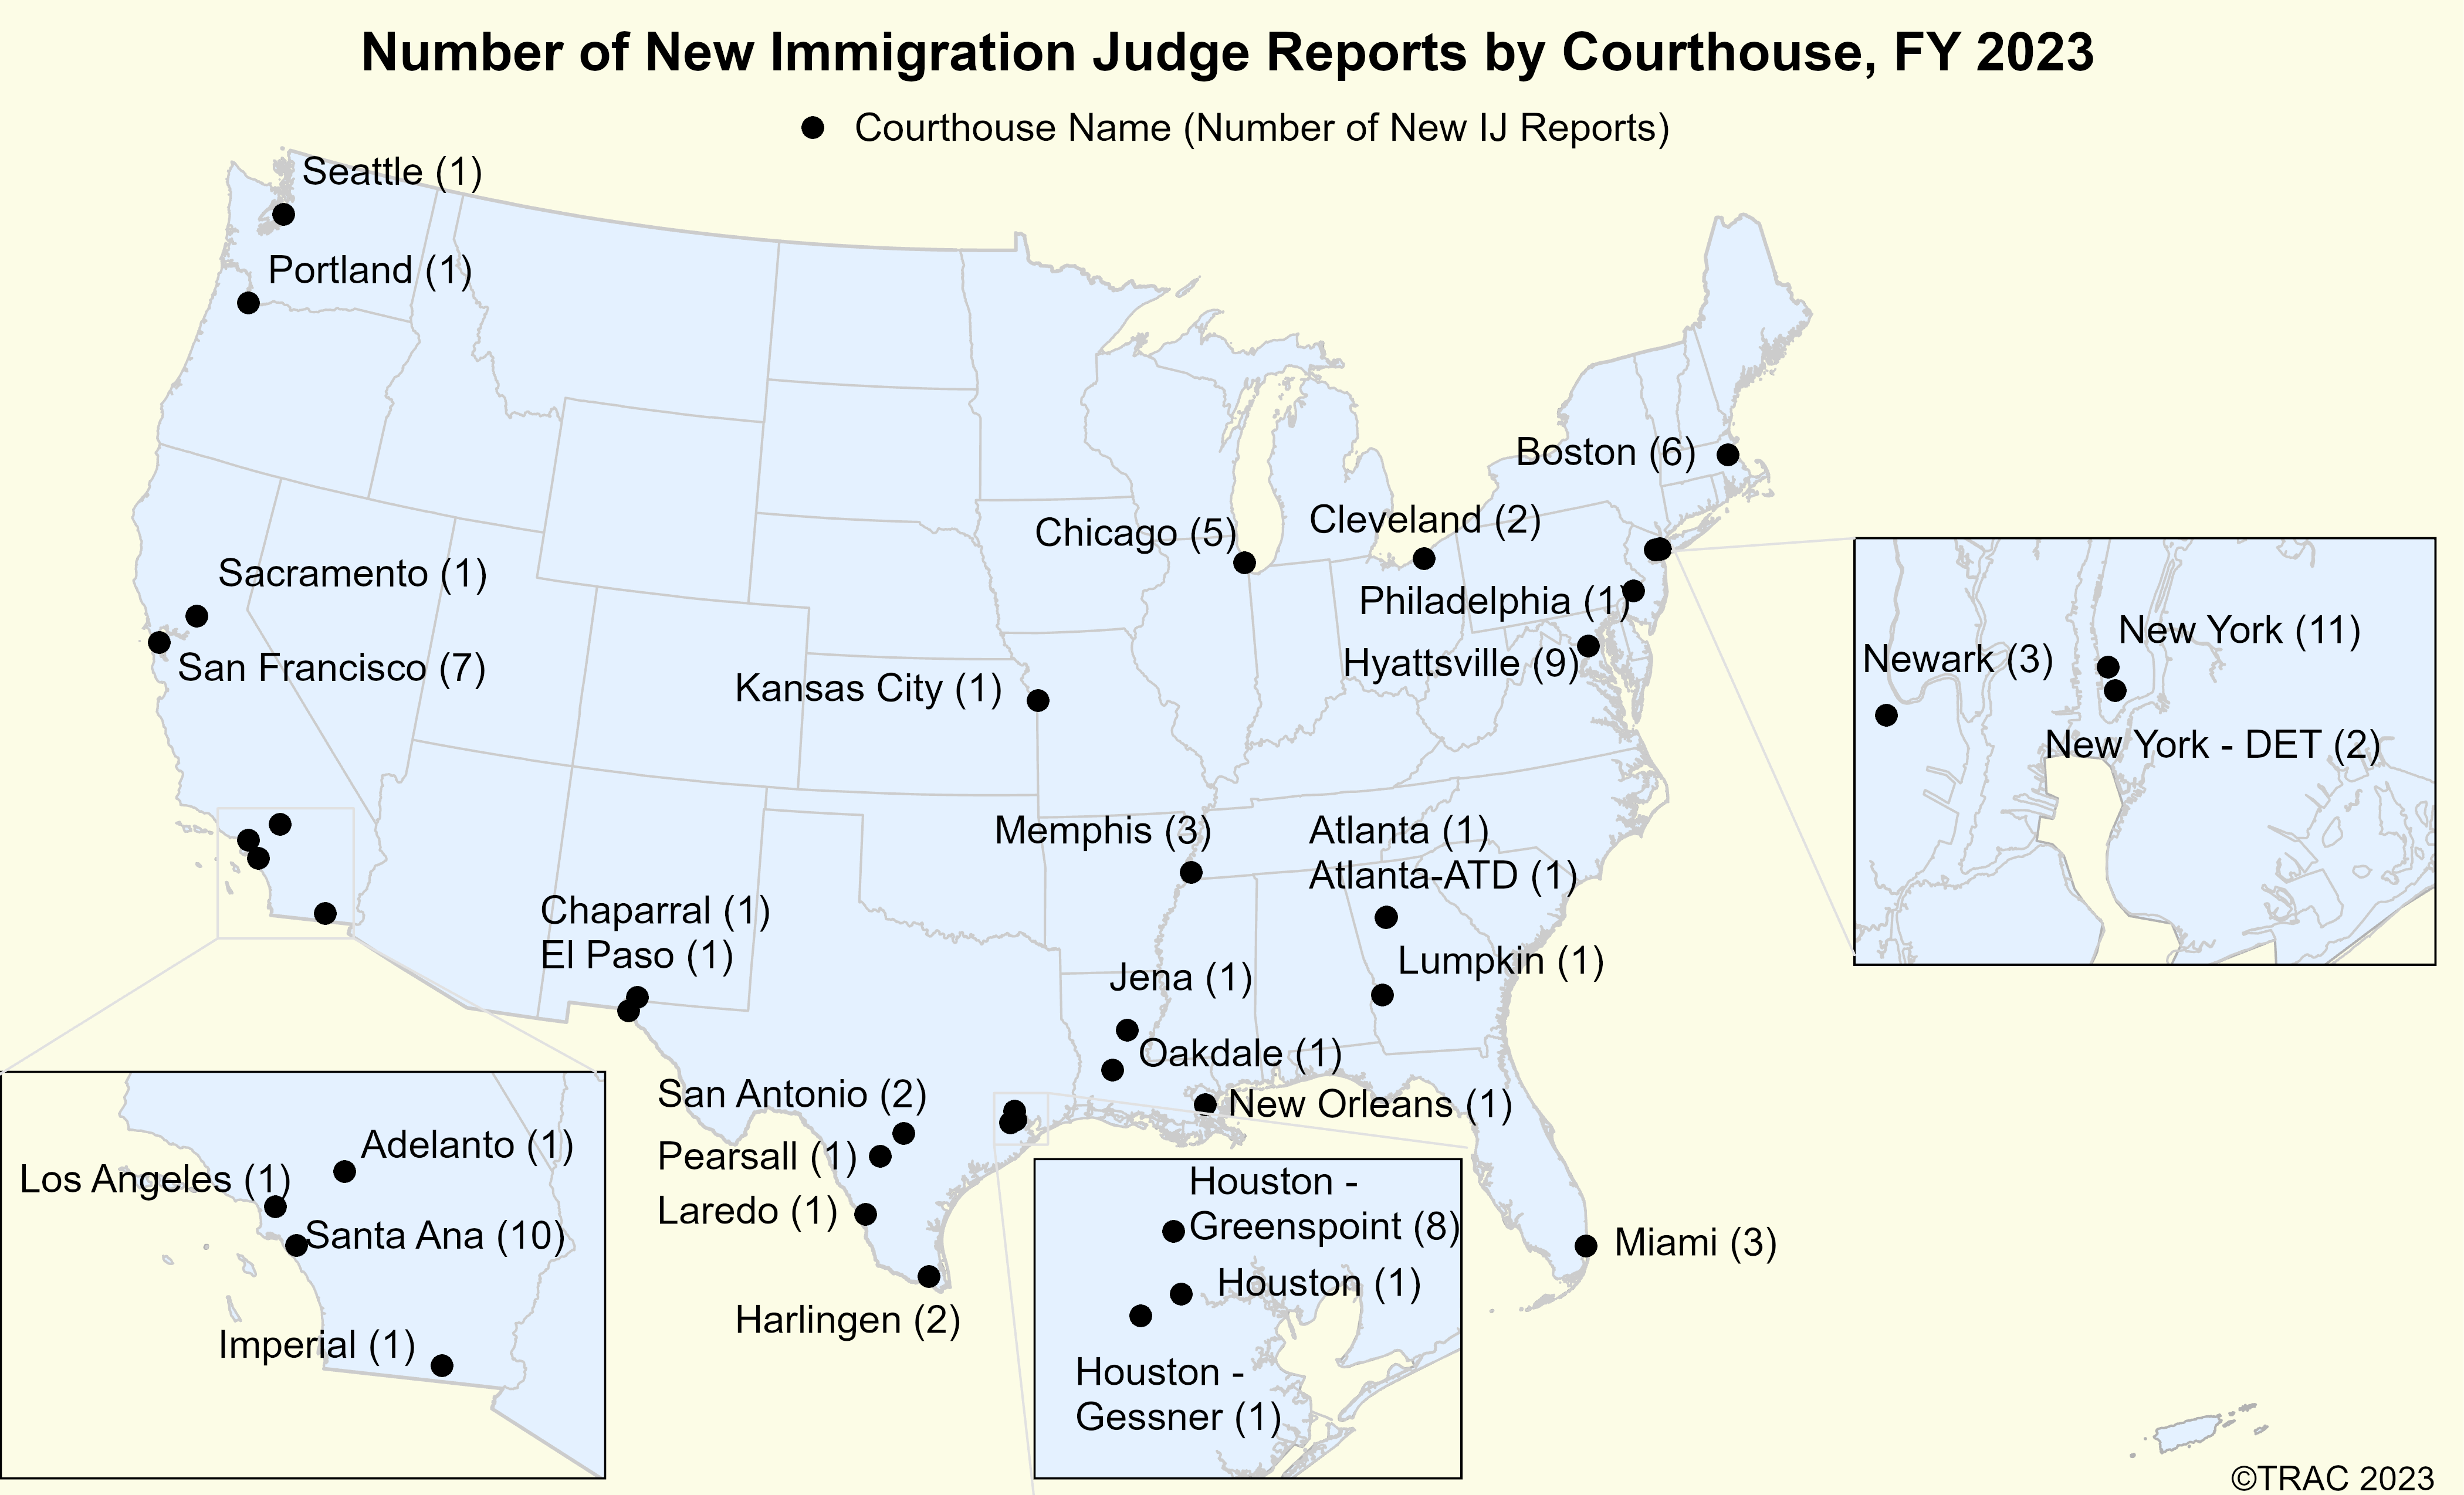
A total of 34 Immigration Courts had judges newly covered by TRAC’s Judge series. Among these locations, the largest number, with 11 new Judge reports in total, occurred for New York City, followed by the Santa Ana Immigration Court in California (10 new reports) and the Hyattsville Immigration Court based in Virginia (9 new reports). The Houston - Greenspoint (8), and San Francisco (7) Immigration Courts rounded out the top five courts with the most new judges who made the list.
Figure 1 below shows a map of Immigration Courts with new Judge Reports, with the total number of new reports in parentheses. For each of these Courts, the names of these new judges along with their asylum grant and denial rates are listed in Appendix Table 1 at the end of this report.
The median number of asylum cases decided per judge was 146 – just half the typical asylum cases (278) decided across the entire set of reports including judges who have long served on the bench.
For these judges with first-time reports, the number of asylum decisions ranged from a low of 100 (TRAC’s minimum threshold) to a maximum of 547. Judge Richard Bailey of the Newark Immigration Court decided the largest number (547) of these cases. Four other Judges have decided 400 more including: Michelle Kahan of Boston, John Decure of New York - DET, Christine Reis of Miami, and Lettricea L. Jefferson-Webb of San Francisco.
Immigration Judges are tasked with the heavy responsibility of adjudicating asylum applications filed by immigrants in removal proceedings. Asylum applicants must show that they face (or have faced) persecution and should not be forced to return to their home country. Considerable discretion is given to each Judge to grant or deny asylum. If a Judge grants asylum, it typically puts the applicant on a pathway toward legal status and citizenship, whereas if a Judge denies asylum—unless alternative grounds are found—it often leads to a deportation order.
Note that asylum cases are just one of many types of cases for which Judges are responsible. Judges also make decisions on a wide variety of types of relief (see TRAC’s report “Beyond Asylum”), other grounds apart from relief for allowing an immigrant to remain in the U.S. (see Outcomes of Immigration Court Proceedings), as well as immigrant detention bonds (see TRAC’s bond data)
Wide Variation in Denial Rates Among Immigration Judges
TRAC’s past research shows significant judge-to-judge variation in asylum grant and denial rates. TRAC has previously found that differences in the availability of legal representation can have a substantial impact on asylum decision outcomes. Differences in locations as well as how hearings are conducted affect the availability of immigration attorneys.[5]
It is also not unexpected that asylum grant rates vary by nationality when conditions in immigrants’ home countries markedly differ or when asylum law creates implicit advantages or disadvantages for particular nationalities. Different nationalities also tend to settle in various parts of the country, which may indirectly tie their asylum outcomes to the asylum denial trends at the closest court while also shaping the asylum denial trends of that court.[6] Denial rates are also shaped by other factors, such as the types of cases on the Judge's docket, the detained status of immigrant respondents, current immigration policies at that Court, and other factors beyond an individual Judge's control.
While the merits of asylum cases vary, disparities in grant and denial rates among judges on the same Immigration Court also appear to reflect, at least in part, the judicial philosophy that the Judge brings to the bench. Much discretion is given to each judge to decide asylum cases, so the denial rates of individual judges is naturally of wide public interest.
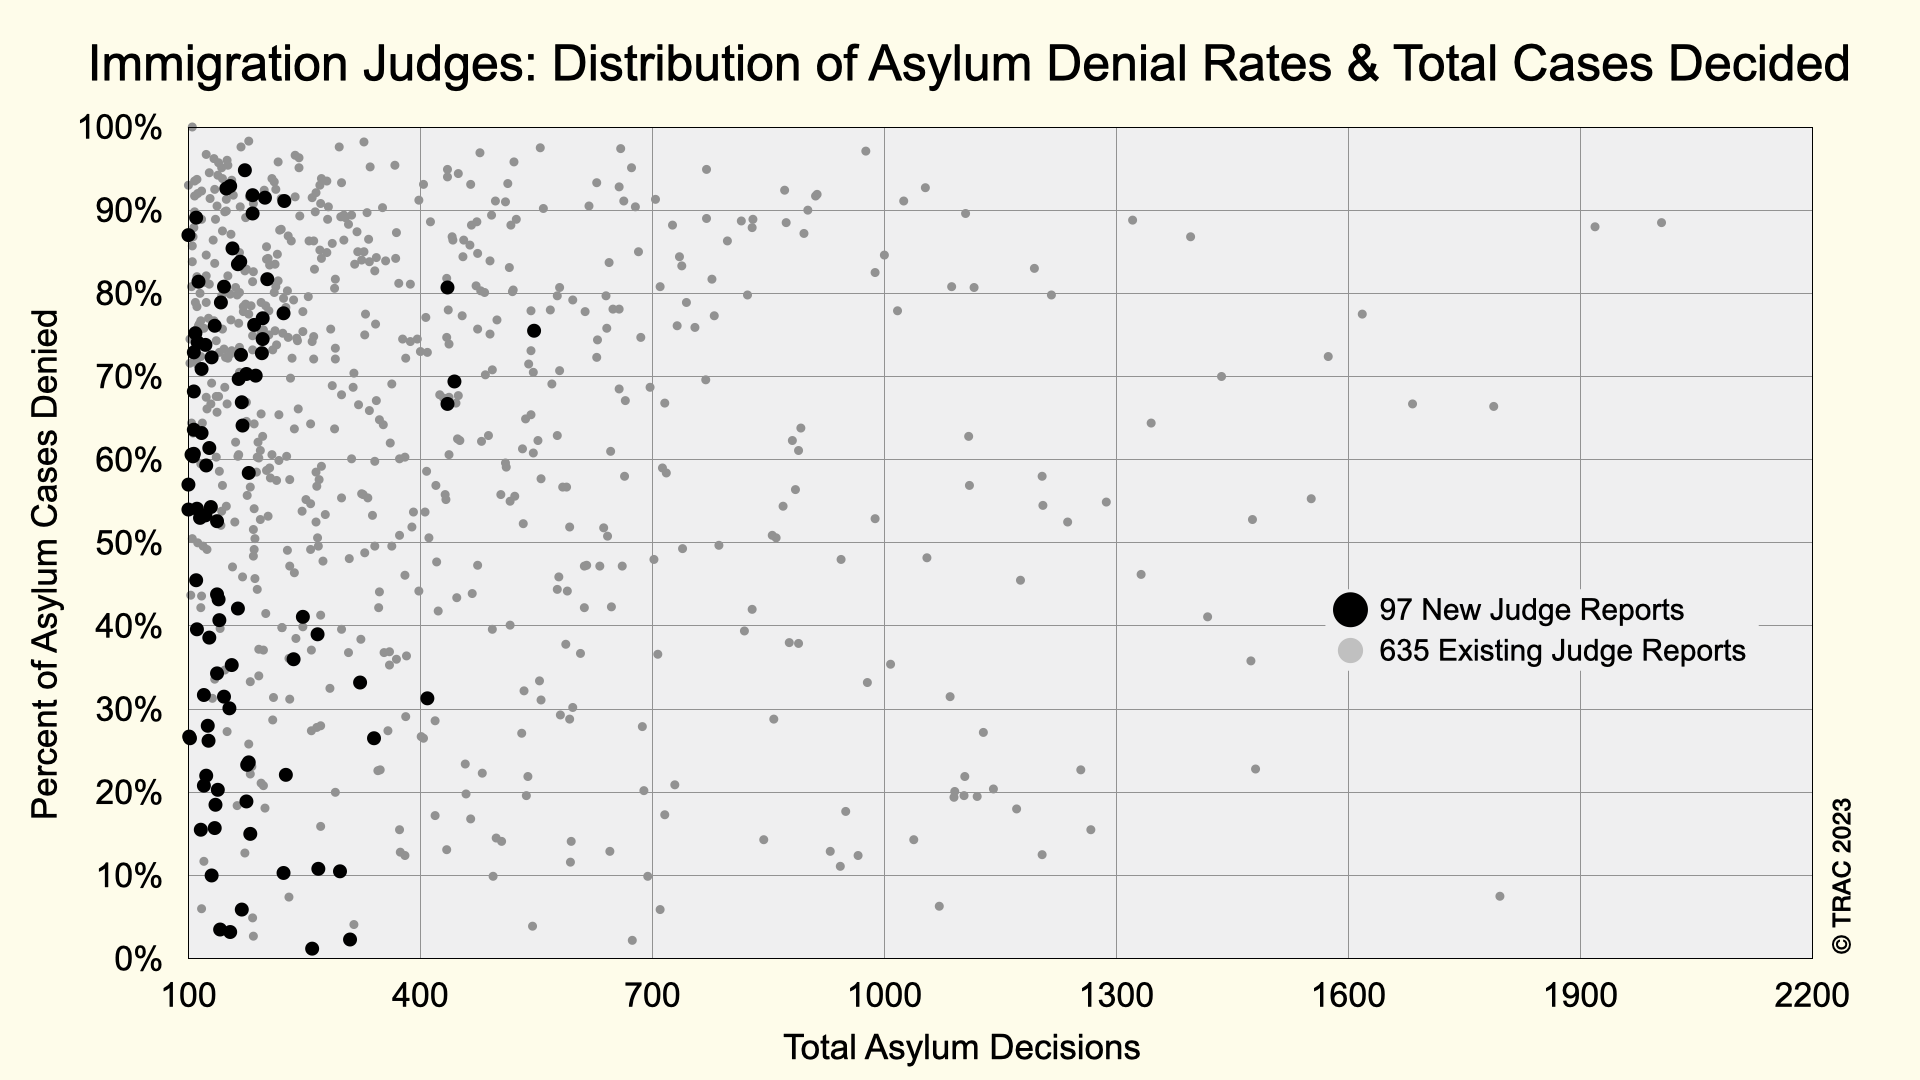
Wide differences in judge asylum denial rates are evident across judges in these new reports – ranging from a high of 94.8% denied by Judge Erica Hughes in Houston down to a low of 1.2% by Judge Chloe Dillon in San Francisco. See Figure 2.
This is, however, little different from the vast range in asylum denial rates among other judges who TRAC has reported on this year. The latest reports show asylum denial rates among non-first-time judges ranged from Judge Bruce Imbacuan in Houston[7] who denied every single one of his 105 asylum cases down to a low of denying just 2.2% of her cases by Judge Shira Levine in San Francisco who has served there since October 2021.
There appears to be little relationship with the volume of asylum decisions a judge renders and these denial rates. See Figure 2. This pattern is little different from what is seen if all immigration judge denial rates were included in the plot.
How Long Immigration Judges Served Before Making The List
During FY 2023, 123 immigration judges were commissioned. Just 21 judges out of these 123 made the list. None of the others had decided 100 or more asylum cases since their appointment. While it is uncommon to decide this many cases during the fiscal year of a judge’s appointment, Judges Adrian Roe and Lucero Saldana Mistry of Boston, both appointed in May 2023 and Judge Michelle A. Slayton of San Francisco, appointed in February 2023, already met the threshold having decided at least 100 asylum cases.
Depending on the Court and the docket to which a Judge is assigned, it may take years to reach the 100-case threshold. For instance, Judge Elizabeth Martinez, who was appointed in March 2019, decided over 100 asylum cases for the first time this past year. Judge Clay Nelson Martin of San Antonio, who was appointed in FY 2016, also only reached the 100-case threshold this year.[8]
| Immigration Court | Judge | Appointment Date | Total Decisions | % Granted Asylum | % Granted Other Relief | % Denied Asylum |
|---|---|---|---|---|---|---|
| Adelanto | Depowell, Bryan E. | 2020 Nov | 110 | 4.5 | 6.4 | 89.1 |
| Atlanta | Taylor, Philip P. | 2020 Jan | 149 | 4.7 | 2.7 | 92.6 |
| Atlanta | Schnitzer, Michael | 2020 June | 113 | 11.5 | 7.1 | 81.4 |
| Atlanta | Watson, Bryan D. | 2020 Nov | 195 | 27.2 | 0.0 | 72.8 |
| Atlanta - ATD | Gallow, Sheila E. | 2020 Jan | 100 | 11 | 2 | 87 |
| Boston | Roe, Adrian N. | 2023 May | 107 | 26.2 | 0.9 | 72.9 |
| Boston | Kahan, Michelle | 2021 Oct | 444 | 30.0 | 0.7 | 69.4 |
| Boston | Napier, Wade Thomas | 2020 Nov | 127 | 36.2 | 2.4 | 61.4 |
| Boston | Saldana Mistry, Lucero | 2023 May | 104 | 37.5 | 1.9 | 60.6 |
| Boston | Cato, Richard | 2022 Oct | 137 | 43.1 | 4.4 | 52.6 |
| Boston | Sady, Michael | 2022 Mar | 248 | 58.5 | 0.4 | 41.1 |
| Chaparral | Girvin, Ralph E. | 2020 Oct | 122 | 11.5 | 14.8 | 73.8 |
| Chicago | Venci, Michelle | 2022 Mar | 170 | 35.9 | 0.0 | 64.1 |
| Chicago | Mencini, Ana | 2022 Oct | 137 | 56.2 | 0 | 43.8 |
| Chicago | Stahl, Marc | 2022 Mar | 267 | 61.0 | 0.0 | 39.0 |
| Chicago | Crites, Elizabeth | 2020 Nov | 178 | 76.4 | 0.0 | 23.6 |
| Chicago | Reynolds, Gina | 2022 Oct | 130 | 90.0 | 0.0 | 10.0 |
| Cleveland | Pashayan, Donald | 2020 Dec | 134 | 20.1 | 3.7 | 76.1 |
| Cleveland | Santoro, Jeremy | 2020 Jan | 107 | 24.3 | 7.5 | 68.2 |
| El Paso | Miller, James J., Jr. | 2020 Oct | 115 | 39.1 | 7.8 | 53.0 |
| Harlingen | Leonard, Joseph T. | 2018 Oct | 117 | 23.1 | 13.7 | 63.2 |
| Harlingen | Garcia, Melissa Joy | 2019 Mar | 106 | 33.0 | 6.6 | 60.4 |
| Houston | Hughes, Erica | 2021 Oct | 173 | 3.5 | 1.7 | 94.8 |
| Houston - Gessner | Thompson, Kenley | 2020 Mar | 117 | 5.1 | 23.9 | 70.9 |
| Houston - Gessner | Dvorak, Charissa | 2020 Mar | 187 | 19.8 | 10.2 | 70.1 |
| Houston - Greenspoint | Hempel, Nicholle M. | 2020 Nov | 154 | 7.1 | 0.0 | 92.9 |
| Houston - Greenspoint | Schwab, Jodie | 2020 Nov | 183 | 6.6 | 1.6 | 91.8 |
| Houston - Greenspoint | Pobjecky, Artie | 2020 Nov | 199 | 7.0 | 1.5 | 91.5 |
| Houston - Greenspoint | White, Romaine | 2020 Nov | 224 | 8.5 | 0.4 | 91.1 |
| Houston - Greenspoint | Jovanovic, Adam | 2021 Oct | 183 | 10.4 | 0 | 89.6 |
| Houston - Greenspoint | Perez, Alex | 2022 Mar | 164 | 15.9 | 0.6 | 83.5 |
| Houston - Greenspoint | Phan, Christopher | 2020 Jan | 202 | 18.3 | 0.0 | 81.7 |
| Houston - Greenspoint | Tamez, Lydia | 2020 Nov | 196 | 21.4 | 1.5 | 77.0 |
| Hyattsville | Bohrer, Matthew | 2021 Oct | 168 | 27.4 | 0.0 | 72.6 |
| Hyattsville | Kanellakos, Thanos | 2021 Oct | 122 | 45.9 | 0.8 | 53.3 |
| Hyattsville | Reilly, Kathleen | 2021 Oct | 164 | 54.9 | 3.0 | 42.1 |
| Hyattsville | Igoe, Alison | 2021 Oct | 156 | 59.6 | 5.1 | 35.3 |
| Hyattsville | Niburg, Rebecca | 2022 Oct | 146 | 67.1 | 1.4 | 31.5 |
| Hyattsville | Bowens, Tanisha | 2022 Mar | 125 | 71.2 | 0.8 | 28.0 |
| Hyattsville | Rubenstein, John S. | 2021 Oct | 226 | 77.0 | 0.9 | 22.1 |
| Hyattsville | Gansallo, Ayodele | 2021 Oct | 135 | 79.3 | 2.2 | 18.5 |
| Hyattsville | Cubas, Claudia | 2021 Oct | 268 | 88.8 | 0.4 | 10.8 |
| Imperial | Munoz, Jeffrey V. | 2020 Dec | 176 | 73.9 | 2.8 | 23.3 |
| Jena | Robbins, Kandra K. | 2021 Oct | 142 | 20.4 | 0.7 | 78.9 |
| Kansas City | Johnson, Colin Patrick | 2020 Mar | 146 | 15.8 | 3.4 | 80.8 |
| Laredo | Santander, Daniel J. | 2010 Oct | 101 | 52.5 | 20.8 | 26.7 |
| Los Angeles | Siebert, Andrea | 2021 Oct | 126 | 71.4 | 2.4 | 26.2 |
| Lumpkin | Brown, Bianca, H | 2020 Jan | 157 | 11.5 | 3.2 | 85.4 |
| Memphis | Newburn, Irma J. | 2021 Oct | 112 | 25.0 | 0.9 | 74.1 |
| Memphis | Josephsen, Brandon J. | 2021 Mar | 165 | 30.3 | 0.0 | 69.7 |
| Memphis | Clancy, Sean D. | 2018 June | 102 | 69.6 | 3.9 | 26.5 |
| Miami | Rosen, Benjamin | 2022 Oct | 167 | 16.2 | 0.0 | 83.8 |
| Miami | Lerner, Romy | 2022 Mar | 185 | 23.8 | 0.0 | 76.2 |
| Miami | Reis, Christine | 2021 Oct | 435 | 33.3 | 0.0 | 66.7 |
| New Orleans | Guillory, Kevin P. | 2021 Oct | 100 | 40.0 | 3.0 | 57.0 |
| New York | Bratton, Scott | 2022 Oct | 139 | 54.7 | 2.2 | 43.2 |
| New York | Pieters, Edwin | 2020 Nov | 140 | 59.3 | 0.0 | 40.7 |
| New York | Krasinski, Carolyn | 2020 Mar | 236 | 63.1 | 0.8 | 36.0 |
| New York | Moore, Carol | 2022 Oct | 137 | 65.7 | 0.0 | 34.3 |
| New York | Dandelet, Kyle | 2021 Oct | 340 | 73.2 | 0.3 | 26.5 |
| New York | Reingold, Jonathan | 2022 Oct | 120 | 77.5 | 1.7 | 20.8 |
| New York | Nassar, Dania | 2022 Oct | 138 | 78.3 | 1.4 | 20.3 |
| New York | Adams, Lori | 2021 Oct | 296 | 89.2 | 0.3 | 10.5 |
| New York | Crawford, Carol A. | 2021 Oct | 223 | 87.4 | 2.2 | 10.3 |
| New York | Koppenhofer, Andrea | 2020 June | 169 | 94.1 | 0.0 | 5.9 |
| New York | Kim, David | 2022 Oct | 154 | 96.1 | 0.6 | 3.2 |
| New York - DET | Decure, John | 2022 Oct | 435 | 18.9 | 0.5 | 80.7 |
| New York - DET | Ouslander, Charles | 2021 Oct | 175 | 29.1 | 0.6 | 70.3 |
| Newark | Bailey, Richard | 2022 Dec | 547 | 23.6 | 0.9 | 75.5 |
| Newark | Panopoulos, Adam | 2022 Dec | 169 | 33.1 | 0.0 | 66.9 |
| Newark | Lane, Nicole | 2022 Mar | 107 | 36.4 | 0.0 | 63.6 |
| Oakdale | Ashworth, Sherron | 2020 Mar | 110 | 8.2 | 2.7 | 89.1 |
| Pearsall | Martinez, Elizabeth | 2019 Mar | 130 | 21.5 | 6.2 | 72.3 |
| Philadelphia | Kulick, Dawn | 2020 Dec | 111 | 60.4 | 0.0 | 39.6 |
| Portland | Lemke, Kathy J. | 2020 Nov | 127 | 59.8 | 1.6 | 38.6 |
| Sacramento | Hitesman, Jonathan W. | 2020 June | 111 | 45.9 | 0.0 | 54.1 |
| Sacramento | Terrazas, Gilda M | 2020 Jan | 100 | 46.0 | 0.0 | 54.0 |
| San Antonio | Martin, Clay Nelson | 2016 June | 123 | 37.4 | 3.3 | 59.3 |
| San Antonio | Santander, Daniel J. | 2010 Oct | 116 | 71.6 | 12.9 | 15.5 |
| San Francisco | Nava, Marlem | 2022 Oct | 129 | 44.2 | 1.6 | 54.3 |
| San Francisco | Pierce, Curtis F. | 2022 Mar | 322 | 65.8 | 0.9 | 33.2 |
| San Francisco | Jefferson-Webb, Lettricea L. | 2021 Oct | 409 | 68.7 | 0.0 | 31.3 |
| San Francisco | Slayton, Michelle A. | 2023 Feb | 123 | 78.0 | 0.0 | 22.0 |
| San Francisco | Davis, Howard R. | 2022 Oct | 141 | 96.5 | 0.0 | 3.5 |
| San Francisco | Chen, Shuting | 2022 Oct | 309 | 97.7 | 0.0 | 2.3 |
| San Francisco | Dillon, Chloe S. | 2022 Oct | 260 | 98.5 | 0.4 | 1.2 |
| Santa Ana | Ghasri, Iman | 2021 Oct | 109 | 22.9 | 1.8 | 75.2 |
| Santa Ana | Lee, Wilbur | 2020 Oct | 196 | 23 | 2.6 | 74.5 |
| Santa Ana | Winfield, Jennifer | 2022 Mar | 107 | 37.4 | 1.9 | 60.7 |
| Santa Ana | Brooks, Alicia | 2021 Oct | 178 | 41.0 | 0.6 | 58.4 |
| Santa Ana | Huang, Jonathan | 2021 Oct | 110 | 50.9 | 3.6 | 45.5 |
| Santa Ana | Chan, Matthew | 2021 Oct | 120 | 66.7 | 1.7 | 31.7 |
| Santa Ana | Noche, Joyce | 2021 Oct | 153 | 68.0 | 2.0 | 30.1 |
| Santa Ana | Mabry Iii, William | 2022 Mar | 175 | 79.4 | 1.7 | 18.9 |
| Santa Ana | Levin, Victoria | 2021 Oct | 134 | 82.8 | 1.5 | 15.7 |
| Santa Ana | Fishkin, Andrew | 2021 Oct | 180 | 81.7 | 3.3 | 15.0 |
| Seattle | Tisocco, Michael | 2022 Dec | 223 | 22.0 | 0.4 | 77.6 |