The Impact of Nationality, Language, Gender and Age on Asylum Success
As TRAC previously reported, under the new Biden administration asylum seekers are seeing greater success in securing asylum in Immigration Court. While asylum grant rates declined during the Trump years to a low of just 29 percent in FY 2020, they climbed to 37 percent during FY 2021 after President Biden assumed office. Focusing just on the most recent quarter (July — September 2021), asylum seekers success rate climbed to 49 percent, up even over the 44 percent success rate at the end of the Obama administration.
This report drills into these data in greater detail in four substantive sections:
- Section 1 examines how asylum seekers from different countries faired in obtaining asylum before Immigration Judges.
- Section 2 further explores differences based upon the language spoken by asylum seekers.
- Section 3 turns to never-before-compiled data on how asylum grant rates may be influenced by gender and age.
- Section 4 concludes with how the nationality composition of asylum seekers has helped shape trends, and the generally higher success rates in affirmative versus defensive Immigration Court asylum cases over the past two decades.
Results are based on a detailed analysis of case-by-case Immigration Court records by the Transactional Records Access Clearinghouse (TRAC) at Syracuse University. These data were obtained through a series of Freedom of Information Act (FOIA) requests, and cover the entire period from October 2000 — September 2021 (FY 2001 - FY 2021).
Asylum Decisions by Nationality
Nationality, including the conditions prevalent in different countries, have been abiding factors which influence whether or not Immigration Judges award asylum. Over the past two decades, asylum seekers from some countries have been highly successful and have been granted asylum in Immigration Court proceedings, while those from other countries have faced greater difficulty.
Depending upon the period of time, various nationalities have predominated among those seeking asylum. This section focuses on nineteen leading countries from which asylum seekers have come over the past two decades. These selected nationalities were chosen by their top rankings on the number seeking asylum.[1] The selection includes nationalities that predominated at times in the past, along with predominant groups today.
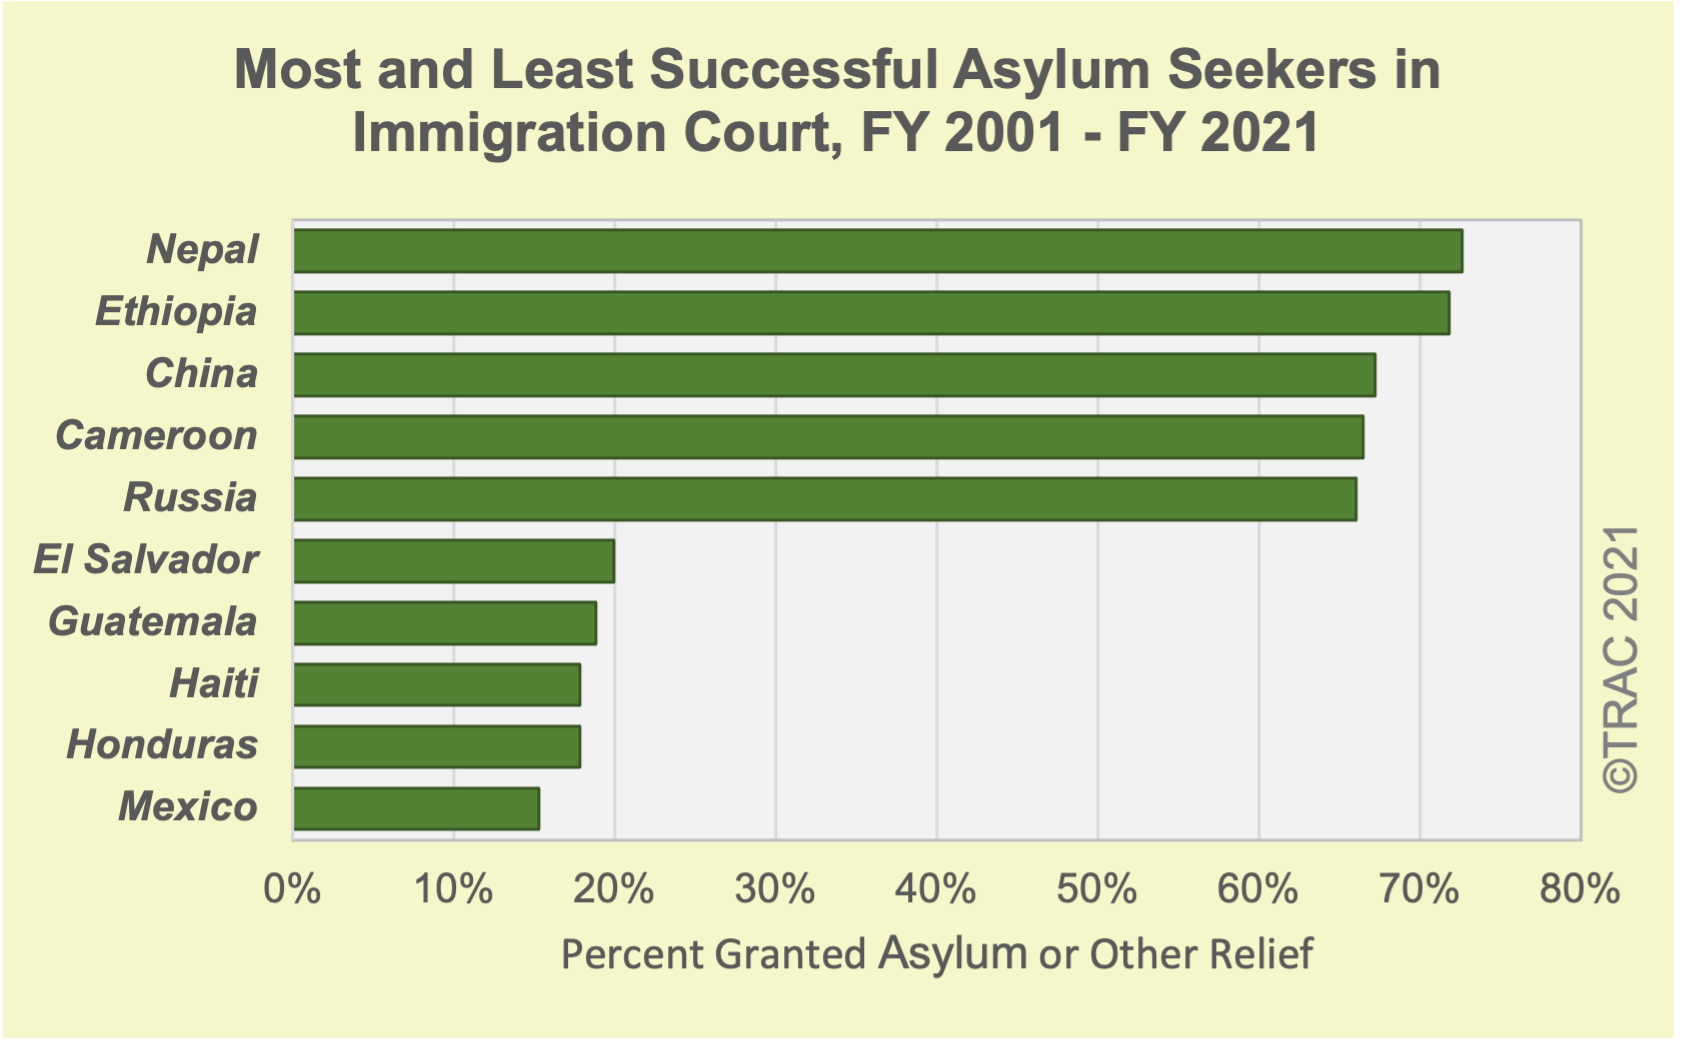
For these nineteen nationality groups, the highest overall asylum success rates over the past two decades in Immigration Court have been persons from Nepal (73%), Ethiopia (72%), China (67%), Cameroon (66%) and Russia (66%). See Figure 1. China has led all other countries in the sheer number of asylum seekers. TRAC examined all asylum decisions in case-by-case Immigration Court records covering FY 2001-FY 2021. Out of the 626,927 total asylum decisions recorded, fully 112,394 — or nearly one in five (18%) — were sought by individuals from China. And nearly one out of every three (30%) of all those granted asylum over the last two decades by Immigration Judges were from China. See Table 1.
(Click for larger image)
The five least successful nationalities, those with the lowest asylum success rates in Immigration Court, are also shown in Figure 1. These include asylum success rates for individuals from Mexico (15%), Honduras and Haiti (each 18%), Guatemala (19%) and El Salvador (20%). In aggregate, individuals from Honduras, Guatemala, and El Salvador together are the largest segment of asylum seekers in recent years. Over the past two decades, 28,745 individuals from these three Northern Triangle countries have been granted asylum. An additional 2,733 were granted other forms of relief. These represent just 12 percent of those granted asylum over the last two decades — far fewer than the number from China.
The remaining nine leading nationalities between these top five and bottom five countries by asylum success rates were: Albania (56%), India (56%), Somalia and Armenia (each 54%), Venezuela (49%), Cuba (39%), Columbia (36%), Indonesia (32%), and Nicaragua (29%). Full details for each of these major origins of asylum seekers are shown in Table 1.
| Nationality | All Asylum Decisions | Outcomes(%) | ||||
|---|---|---|---|---|---|---|
| Total | Denied | Granted* | Total | Denied | Granted* | |
| All | 626,927 | 365,783 | 261,144 | 100% | 58% | 42% |
| Mexico | 42,726 | 36,199 | 6,527 | 100% | 85% | 15% |
| Honduras | 45,090 | 37,064 | 8,026 | 100% | 82% | 18% |
| Haiti | 32,251 | 26,502 | 5,749 | 100% | 82% | 18% |
| Guatemala | 56,803 | 46,144 | 10,659 | 100% | 81% | 19% |
| El Salvador | 64,177 | 51,384 | 12,793 | 100% | 80% | 20% |
| Nicaragua | 4,790 | 3,416 | 1,374 | 100% | 71% | 29% |
| Indonesia | 10,700 | 7,238 | 3,462 | 100% | 68% | 32% |
| Colombia | 25,855 | 16,524 | 9,331 | 100% | 64% | 36% |
| Cuba | 8,470 | 5,141 | 3,329 | 100% | 61% | 39% |
| Venezuela | 9,339 | 4,743 | 4,596 | 100% | 51% | 49% |
| Armenia | 6,334 | 2,912 | 3,422 | 100% | 46% | 54% |
| Somalia | 5,389 | 2,472 | 2,917 | 100% | 46% | 54% |
| India | 21,148 | 9,361 | 11,787 | 100% | 44% | 56% |
| Albania | 10,567 | 4,658 | 5,909 | 100% | 44% | 56% |
| Russia | 6,906 | 2,349 | 4,557 | 100% | 34% | 66% |
| Cameroon | 8,510 | 2,856 | 5,654 | 100% | 34% | 66% |
| China | 112,394 | 36,855 | 75,539 | 100% | 33% | 67% |
| Ethiopia | 8,513 | 2,400 | 6,113 | 100% | 28% | 72% |
| Nepal | 7,139 | 1,956 | 5,183 | 100% | 27% | 73% |
| All Other | 139,826 | 65,609 | 74,217 | 100% | 47% | 53% |
How Have Nationalities Fared Under Biden?
While overall asylum grant rates rose under President Biden, the question remains: was this generally true for most nationality groups? Given the wide range in success rates among nationalities, it is possible that changes in the composition of asylum seekers could have made it appear that grant rates were rising when no real change in any specific nationality's success rate had occurred.
To examine this further question, asylum grant and denial rates by nationality were compiled for FY 2020 and compared with FY 2021. Eighteen out of these nineteen leading nationalities each experienced an increase in their asylum success rates[2](see Table 2). This is unlikely to have occurred by chance. Thus, when overall trends hold up for nationality after nationality, one's confidence increases that real change took place between the Trump and Biden administrations.
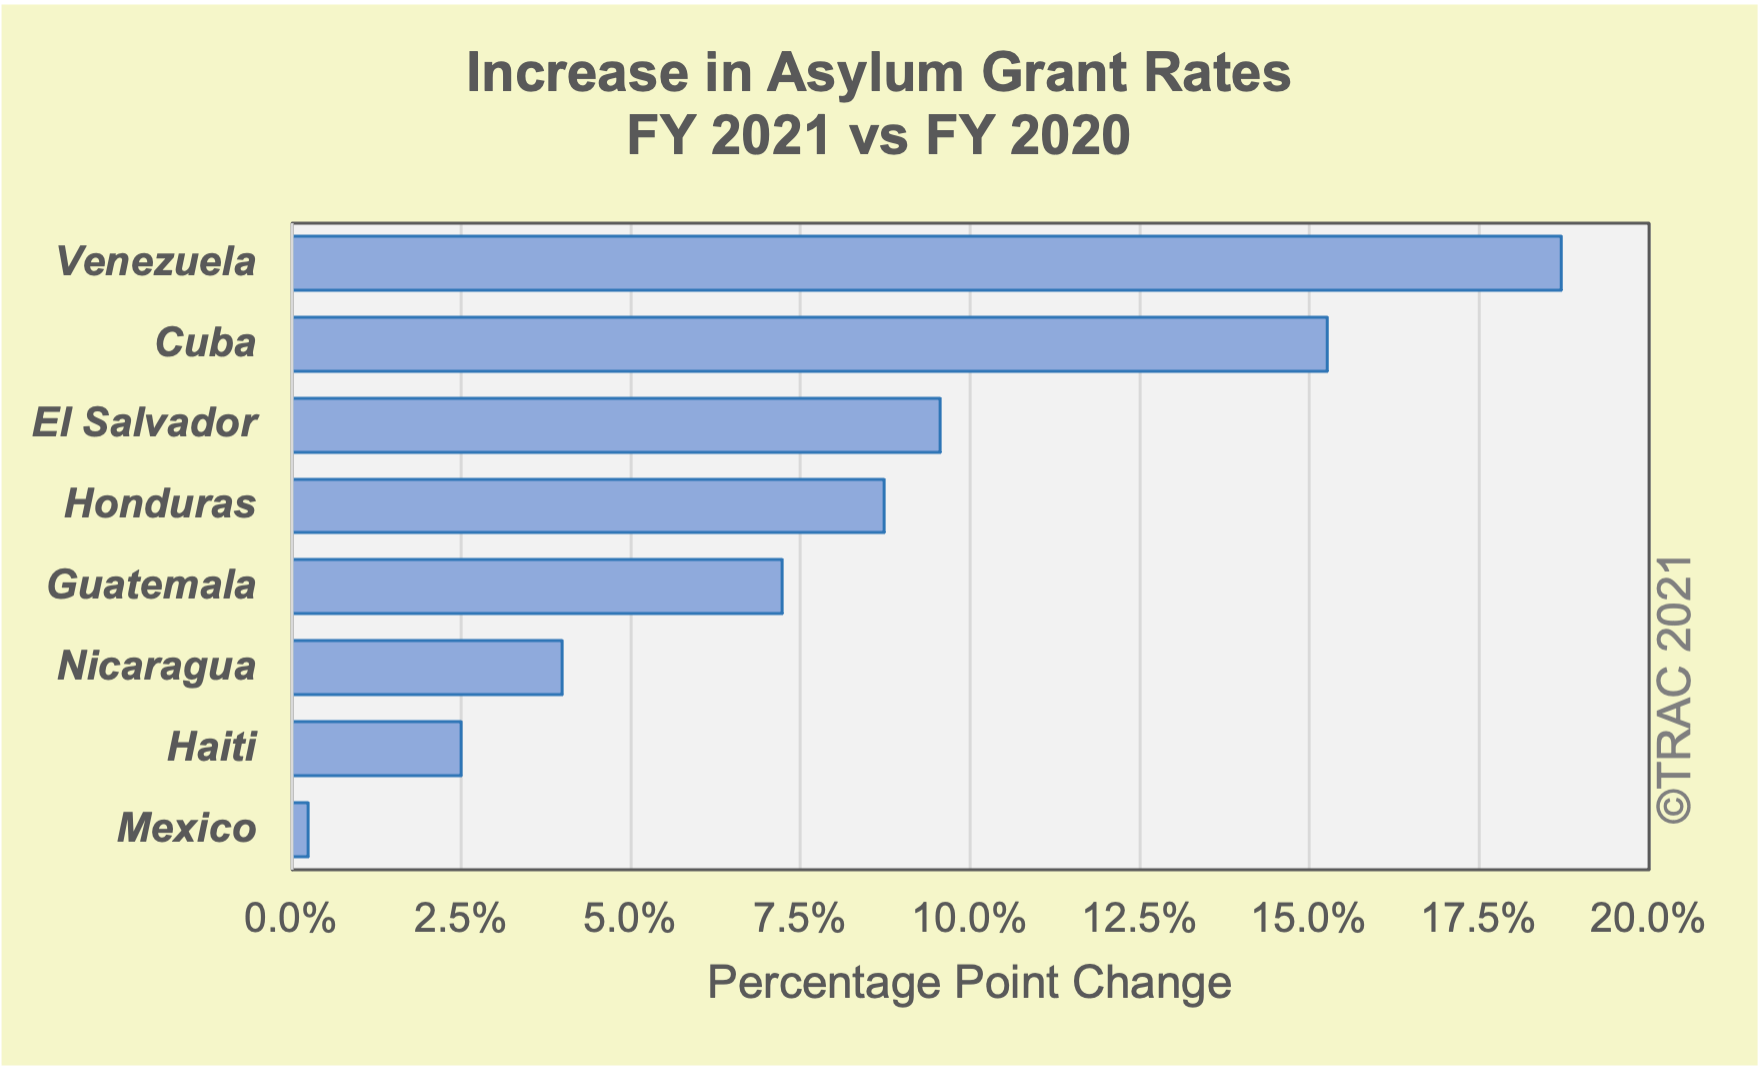
Among the countries where asylum seekers saw increasing asylum grant rates during FY 2021 are many from Central and South America as well as the Caribbean. See Figure 3. Individuals from both Venezuela and Cuba saw grant rates that rose over 15 percentage points. Asylum seekers from El Salvador, Honduras, and Guatemala had grant rates that increased between 7 and 10 percentage points. Immigrants from Haiti and Nicaragua saw increases in asylum grant rates between 2.5 and 4 percentage points between FY 2020 and FY 2021.
(Click for larger image)
Some cautions should be noted. Those from Mexico saw a trivial increase (0.2 percentage points) which could well reflect mere chance variability. President Biden has been in office for less than a year, and these data reflect just the first eight months of his administration. Further, the number of asylum cases being decided each month since March 2020 have fallen to historic lows due to the partial Court shutdown with the COVID-19 pandemic. Court hearings and asylum decisions remain low and have not recovered. Whether trends from these limited months and relatively small volume of decisions will continue will require careful monitoring.
| Nationality | FY 2020 | FY 2021 | Percent Granted* | 2020vs2021 Change |
|||||||
|---|---|---|---|---|---|---|---|---|---|---|---|
| Total | Granted | Denied | Other* | Total | Granted | Denied | Other* | FY 2020 | FY 2021 | ||
| All | 60,079 | 15,976 | 42,589 | 1,514 | 23,827 | 8,349 | 15,076 | 402 | 29% | 37% | 7.6% |
| Armenia | 117 | 65 | 51 | 1 | 66 | 50 | 15 | 1 | 56% | 77% | 20.9% |
| Cameroon | 1,605 | 887 | 608 | 110 | 334 | 271 | 61 | 2 | 62% | 82% | 19.6% |
| Venezuela | 1,839 | 942 | 834 | 63 | 856 | 619 | 228 | 9 | 55% | 73% | 18.7% |
| Russia | 411 | 271 | 123 | 17 | 219 | 185 | 31 | 3 | 70% | 86% | 15.8% |
| Cuba | 3,757 | 1,330 | 2,266 | 161 | 646 | 341 | 291 | 14 | 40% | 55% | 15.3% |
| El Salvador | 10,710 | 1,814 | 8,717 | 179 | 4,442 | 1,183 | 3,191 | 68 | 19% | 28% | 9.6% |
| Honduras | 9,741 | 1,084 | 8,458 | 199 | 3,224 | 665 | 2,518 | 41 | 13% | 22% | 8.7% |
| Nepal | 458 | 329 | 125 | 4 | 176 | 143 | 33 | 0 | 73% | 81% | 8.5% |
| Ethiopia | 128 | 82 | 44 | 2 | 85 | 62 | 23 | 0 | 66% | 73% | 7.3% |
| Guatemala | 11,619 | 1,506 | 9,935 | 178 | 4,501 | 927 | 3,523 | 51 | 14% | 22% | 7.2% |
| India | 2,145 | 1,318 | 769 | 58 | 946 | 663 | 274 | 9 | 64% | 71% | 6.9% |
| Colombia | 188 | 37 | 141 | 10 | 173 | 51 | 120 | 2 | 25% | 31% | 5.6% |
| China | 2,731 | 2,073 | 636 | 22 | 992 | 791 | 189 | 12 | 77% | 81% | 4.2% |
| Nicaragua | 1,079 | 391 | 660 | 28 | 446 | 187 | 255 | 4 | 39% | 43% | 4.0% |
| Albania | 121 | 82 | 39 | 0 | 38 | 27 | 11 | 0 | 68% | 71% | 3.3% |
| Haiti | 632 | 54 | 561 | 17 | 255 | 31 | 220 | 4 | 11% | 14% | 2.5% |
| Somalia | 64 | 20 | 40 | 4 | 48 | 16 | 29 | 3 | 38% | 40% | 2.1% |
| Mexico | 6,221 | 768 | 5,209 | 244 | 2,842 | 388 | 2,373 | 81 | 16% | 17% | 0.2% |
| Indonesia | 68 | 49 | 18 | 1 | 30 | 17 | 13 | 0 | 74% | 57% | -16.9% |
| Other Countries | 6,445 | 2,874 | 3,355 | 216 | 3,508 | 1,732 | 1,678 | 98 | 48% | 52% | 4.2% |
Language and Asylum Success Rates
Asylum cases are complex. They rely heavily on personal testimony, and asylum seekers come from all over the world. As a result, the language of asylum seekers is an important consideration for the Immigration Court system, which is obligated to provide interpreters for immigrants whose best language is not English. Moreover, since language use does not always map directly onto nationality and may indicate belonging to minority social groups (e.g. indigenous groups in Central America), [3]data on the recorded language [4] of asylum seekers in Immigration Court can provide an added level of insight into asylum cases. While asylum seekers over the last two decades came from over 200 countries, individuals spoke over 400 different languages.
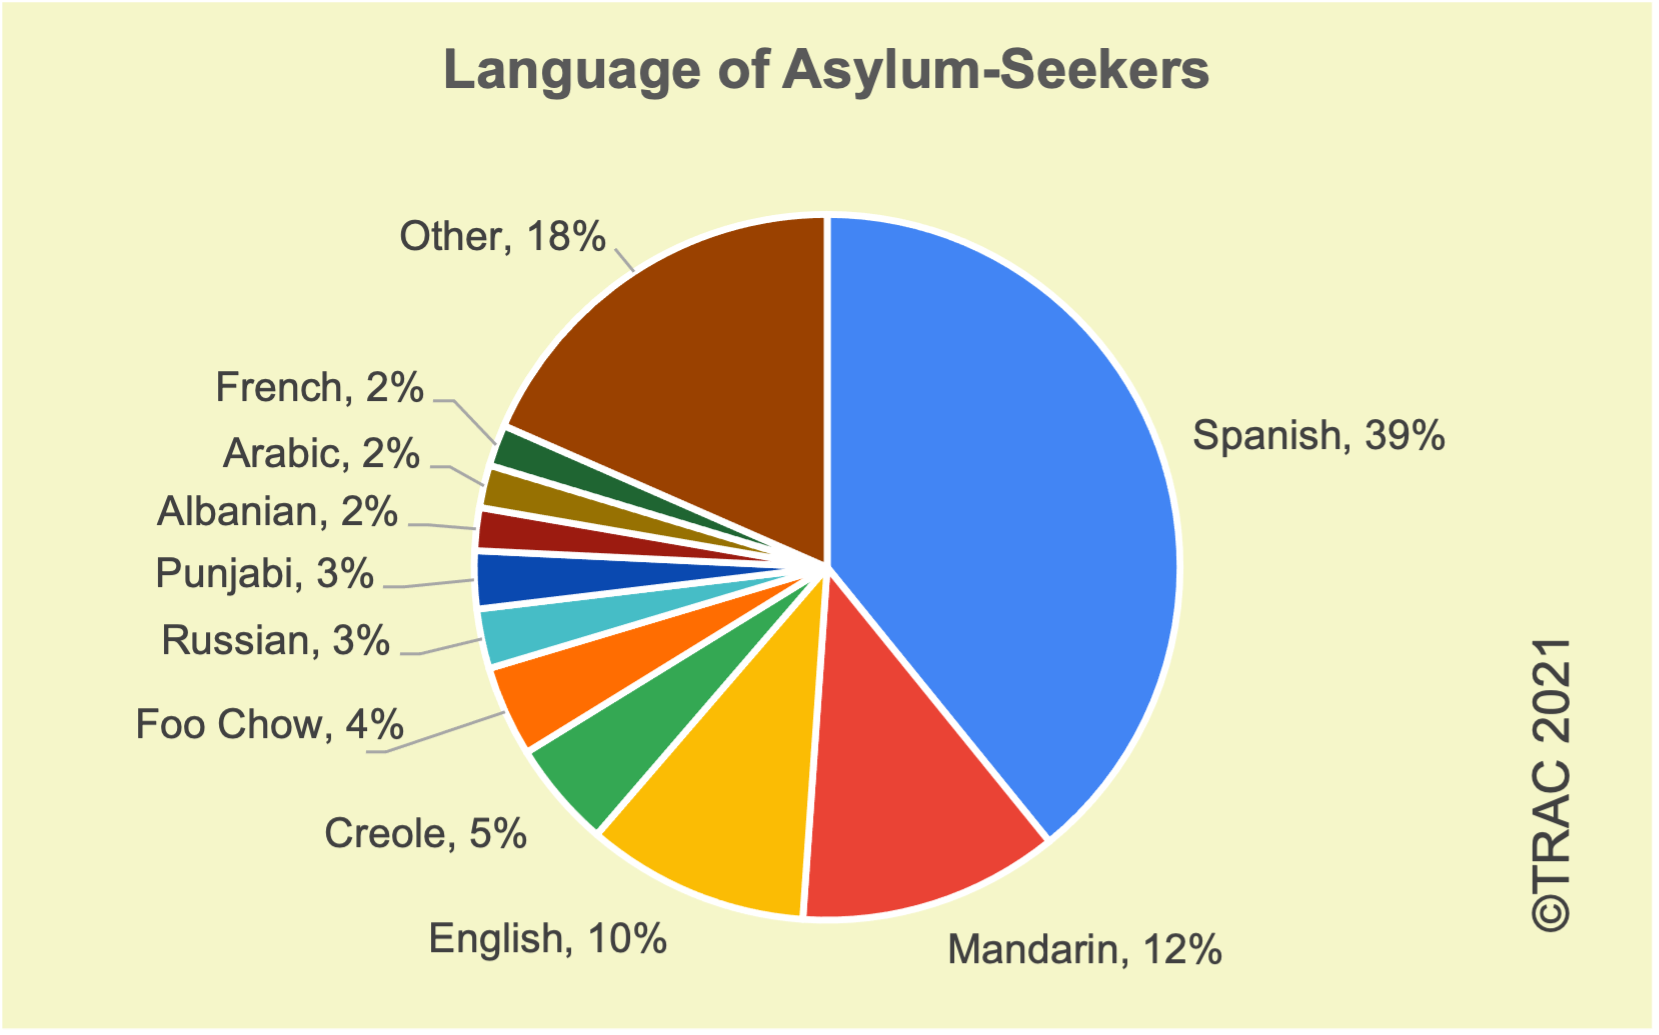
Spanish was by far the most common language listed for asylum seekers. Spanish was recorded as the applicant's language on 245,534 cases which made up 39 percent of all asylum cases decided over the past two decades. Mandarin (12%) and English (10%) come in second and third for all cases, with Creole (spoken mainly in Haiti) and Foo Chow (spoken mainly in China) coming in fourth and fifth. Punjabi, French, and Arabic stand out for being spoken in many countries around the world. Punjabi speakers mainly identify as from India (more than 95%) or Pakistan. French was recorded as spoken by people from 80 countries, mainly in West Africa such as Cameroon, Guinea, and Congo. Arabic was recorded as spoken by people from more than 75 countries, with Egypt, Iraq, Syria, and Sudan listed as the top four nationalities. See Figure 3 for a breakdown of the top ten most common languages used by asylum seekers in Court decisions covering FY 2001 - FY 2021.
(Click for larger image)
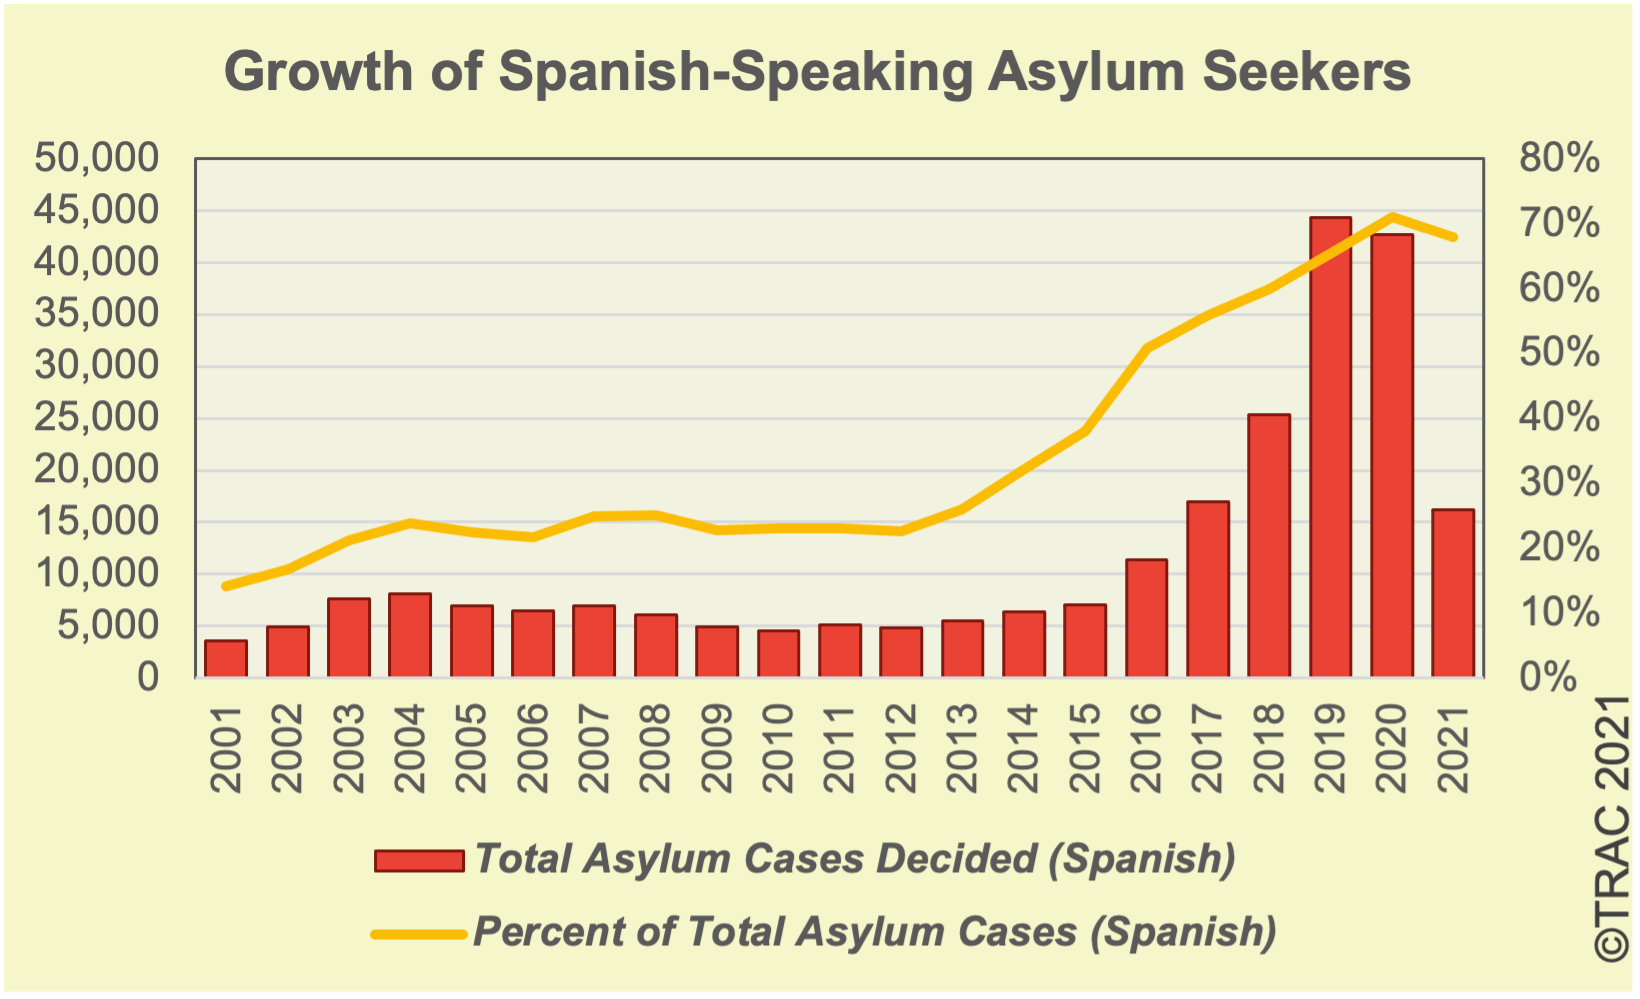
Spanish is the most common language now, but this was not always the case. In FY 2001, Spanish-speakers comprised just 14 percent of all asylum cases and increased to little more than 25 percent by FY 2013. In FY 2014, however, the percentage of cases involving Spanish-speakers crossed 30 percent and continued to rise to a height of 71 percent in FY 2020, declining slightly to 68 percent of all asylum cases decided in FY 2021. See Figure 4. The largest number of Spanish-speaking asylum seekers were from El Salvador, but other nationalities included Guatemala, Honduras, and Mexico. Altogether 93 countries were represented among Spanish-speakers alone.
(Click for larger image)
The top ten most common languages listed for FY 2021 differ only slightly from the top ten most common languages overall since FY 2001. Mam and Portuguese that weren't in the overall top ten rise to sixth and eighth place respectively in 2021, while Foo Chow and Albanian are no longer featured. All others remain the same with Spanish, English, and Mandarin at the top of the list. More than 99 percent of the 3,816 recorded Mam speakers were listed as Guatemalan. Mam is a Mayan language spoken by a significant number of people in Guatemala. Of the 2,483 recorded Portuguese speakers, 86 percent were listed as Brazilian and smaller numbers identified as being from Angola and Guinea Bissau (both African countries) as well as Portugal.
Even though languages do not always map directly onto countries, understanding the difference that language makes in asylum outcomes can be seen by comparing the outcomes of different language speakers from the same countries. For example, the denial rate for asylum applications for people from El Salvador—where Spanish and English are, by far, the dominant recorded languages—is 80 percent, with less than a percentage point change whether the applicant spoke English or Spanish.
However, in Guatemala, a country with many more languages recorded in the Immigration Court's data, the rate of asylum denial varies in important ways from language to language. For example, 83 percent of Spanish-speaking Guatemalan's are denied asylum and this rises for both Konjobal speakers and Quiche speakers to an 87 percent denial rate. Kekchi speakers are denied asylum 93 percent of the time. Conversely, the asylum denial rate is lower for English-speaking Guatemalans at 72 percent, and much lower for Mam speakers at 57 percent. See Figure 5 below.
A similar phenomenon can be found among asylum seekers from China, which has an overall denial rate of just 33 percent. Foo Chow and Cantonese speakers see higher rates of denial at 39.5 and 44 percent respectively compared to lower rates of denial by Mandarin speakers (31%) and English speakers (23.5%). Tibetan speakers had just a 14 percent asylum denial rate.

(Click for larger image)
Age and Gender and Asylum Success Rates
Until recently, few case-by-case Immigration Court records included the gender or age of individuals appearing before the Court. Only in the last few years were either of these items included on at least half of the Court's new cases.
Because of the potential significance of these two demographic factors in asylum cases, TRAC has added these to our free web-query tool. The query tool covers the last twenty years. However, only during the last two years has reporting on gender and age on asylum cases risen enough to reach about 70 percent. Currently, demographic measures on asylum cases were still missing on the remaining 30 percent.
Focusing just on a comparison of FY 2020 with FY 2021, TRAC compiled asylum success rates for each of these demographic classes. This report discusses these results.
Gender. Males slightly outnumber females in both of these two years based on cases where gender was recorded. Fifty-five percent were males, and forty-five percent were females. Asylum grant rates were roughly the same for males and females during the last full year of the Trump administration. But females show an 11.0 percentage point rise in FY 2021, compared with just a 5.7 percentage point increase for males—about half the increase. See Table 3.
While tantalizing as these results may seem, especially in light of hotly contentious disputes over whether some gender-based asylum claims were valid, caution is still warranted. As we noted for nationality, these data cover only the initial months of the Biden administration. And for gender, we have an additional complicating factor present: the relatively large number of cases where gender is unknown. The uncertainty introduced by these unknowns is also elevated because individuals for whom gender was unknown had significantly higher asylum grant rates than when gender was known. See Table 3. This means we cannot assume that unknown gender and known gender cases were similar.
| Gender | FY 2020 | FY 2021 | Percent Granted* | 2020vs2021 Change |
|||||||
|---|---|---|---|---|---|---|---|---|---|---|---|
| Total | Granted | Denied | Other* | Total | Granted | Denied | Other* | FY 2020 | FY 2021 | ||
| All | 60,079 | 15,976 | 42,589 | 1,514 | 23,827 | 8,349 | 15,076 | 402 | 29% | 37% | 7.6% |
| Female | 19,586 | 4,427 | 14,781 | 378 | 7,651 | 2,649 | 4,933 | 69 | 25% | 36% | 11.0% |
| Male | 23,093 | 5,306 | 17,025 | 762 | 9,619 | 2,849 | 6,543 | 227 | 26% | 32% | 5.7% |
| Unknown | 17,400 | 6,243 | 10,783 | 374 | 6,557 | 2,851 | 3,600 | 106 | 38% | 45% | 7.1% |
Age.[5] Juveniles have generally lower asylum grant rates than adults in Immigration Court data covering FY 2020. For example, that year those up to 4 years of age were granted asylum only 19 percent of the time. Those with ages from 5-11 showed asylum success rates of only 21 percent, while those from 12-17 achieved successful outcomes just 19 percent of the time. These are all far below the overall average grant rate of 29 percent that year.
It is important to note that Immigration Court asylum decisions do not generally cover unaccompanied juvenile cases seeking asylum. In these Court data, most of these children were part of family groups. Unaccompanied juvenile cases due to special provisions in the law are generally not decided by Immigration Court Judges but by Asylum Officers who are part of the United States Citizenship and Immigration Services (USCIS).
Young children in these Court records, however, showed increased success once President Biden assumed office, although still remaining below the grant rates for adults. Children up to four years of age showed an increase in asylum success rates of 11.8 percentage points, while those for children between five and eleven had an increase between FY 2020 and FY 2021 of 10.3 percentage points.
Again, similar cautions are warranted before generalizing these findings. As we noted for nationality, these data cover only the initial months of the Biden administration. And just as we saw with gender, we have an additional complicating factor present: the relatively large number of cases where age was unknown. The uncertainty introduced by these unknowns is similarly also compounded because individuals on whom age was unknown also had significantly higher asylum grant rates than for any group where age was known. See Table 4. As more asylum data arrives with the passing months, drilling further into case-by-case details would appear warranted, including combining gender and age characteristics and identifying sets of individuals who appeared as part of family groups. [6]
| Age** | FY 2020 | FY 2021 | Percent Granted* | 2020vs2021 Change |
|||||||
|---|---|---|---|---|---|---|---|---|---|---|---|
| Total | Granted | Denied | Other* | Total | Granted | Denied | Other* | FY 2020 | FY 2021 | ||
| All | 60,079 | 15,976 | 42,589 | 1,514 | 23,827 | 8,349 | 15,076 | 402 | 29% | 37% | 7.6% |
| 0-4 | 4,443 | 792 | 3,581 | 70 | 1,670 | 510 | 1,149 | 11 | 19% | 31% | 11.8% |
| 5-11 | 6,185 | 1,205 | 4,883 | 97 | 2,235 | 689 | 1,535 | 11 | 21% | 31% | 10.3% |
| 12-17 | 5,339 | 872 | 4,350 | 117 | 2,250 | 571 | 1,654 | 25 | 19% | 26% | 8.0% |
| 18-24 | 5,891 | 1,487 | 4,233 | 171 | 2,513 | 826 | 1,632 | 55 | 28% | 35% | 6.9% |
| 25-34 | 10,611 | 2,643 | 7,585 | 383 | 4,453 | 1,473 | 2,890 | 90 | 29% | 35% | 6.6% |
| 35-44 | 6,004 | 1,513 | 4,278 | 213 | 2,707 | 938 | 1,694 | 75 | 29% | 37% | 8.7% |
| 45-59 | 2,309 | 612 | 1,631 | 66 | 1,088 | 350 | 709 | 29 | 29% | 35% | 5.5% |
| 60+ | 195 | 62 | 128 | 5 | 107 | 41 | 64 | 2 | 34% | 40% | 5.8% |
| Unknown | 19,102 | 6,790 | 11,920 | 392 | 6,804 | 2,951 | 3,749 | 104 | 38% | 45% | 7.3% |
Nationality and Affirmative versus Defensive Asylum Cases
Historically, asylum seekers have had greater success in the Immigration Court for affirmative as compared with defensive asylum cases. Indeed, this has been true for decades. In addition, movements of grant rates up or down over time have been distinctly different. See Figure 6 below. Only part of these differential success rates can be explained by factors such as representation and custody status that TRAC examined in the first part of this two-part report series on Immigration Court asylum decisions.

(Click for larger image)
Most asylum applications today are considered defensive applications and filed in response to the Department of Homeland Security initiating removal proceedings in Immigration Court. An individual may then claim they are entitled to asylum as a defense against removal. [7]
Alternatively, under some circumstances asylum applications can be first submitted to the U.S. Citizenship and Immigration Services (USCIS) when a person does not have a pending deportation cases. If USCIS denies the application, it then generally refers the application to the Immigration Court. This is considered an affirmative application. [8] Successful affirmative asylum applications stop with USCIS, and only unsuccessful ones make their way to the Immigration Court. Why then are these unsuccessful applicants more often granted asylum by Immigration Judges than asylum applicants who go directly to Immigration Court through defensive cases?
Much of the differences between success rates of affirmative versus defensive asylum Immigration Court cases appear to arise because the nationality composition of these two types of cases have been quite different. Nationalities which we saw in Figure 1 that had particularly high asylum grant rates tend to be concentrated among affirmative asylum seekers. Cases from China, for example, make up 27 percent of all affirmative asylum cases. This is over 10 times the proportion in defensive cases. In contrast, nationalities that had particularly low asylum success rates such as Mexico, Honduras, Guatemala, and El Salvador tend to predominate among defensive asylum cases. The Northern Triangle countries have 7 to 13 times the proportion in defensive cases than found for affirmative asylum cases. These compositional differences make affirmative cases as a class appear more successful than the class of defensive cases.
These compositional differences in the percentage distribution of nationalities in affirmative and defensive cases are shown respectively in Figure 7.

(Click for larger image)
This figure displays major changes that have taken place over time in the nationalities making up these two classes of cases. For example, the blue area signifying asylum seekers from China rose sharply for affirmative cases to almost 60 percent before declining again. This roughly corresponds to a period where we saw overall affirmative asylum grant rates rise, and then fall in Figure 6 above. In contrast, we see that the proportion of defensive asylum cases from China has steadily declined over this twenty-year period. And the proportion of asylum seekers from El Salvador, Guatemala, Honduras, and Mexico—all nationalities with low asylum success rates—have risen sharply, but particularly among defensive asylum cases.
Nationality Mediates Affirmative Versus Defensive Asylum Outcomes
Asylum grant rates over the last two decades, as this two-part series has traced, differ sharply between affirmative versus defensive cases in Immigration Court. Only 31 percent of defensive asylum cases have been granted asylum. Fully 64 percent of affirmative cases won asylum—more than twice the proportion. Once nationality is taken into consideration, however, the differences between asylum grant rates for affirmative versus defensive cases greatly diminish. The availability of representation and custody status also play a role.[9]
Indeed, for a number of nationality groups, there is little difference in outcome for affirmative versus defensive cases once representation and custody status are also controlled for. See Table 5. Among these are asylum seekers (in alphabetical order) from Armenia, Cameroon, Cuba, Ethiopia, Guatemala, Nicaragua, Somalia and Venezuela who either have rates within 3 percentage points or actually higher asylum grant rates for defensive cases.
Controlling for language differences can reduce some apparent remaining differences. In China where defensive cases with a 67 percent asylum grant rate, once representation and custody are controlled for, still lag the 78 percent rate for affirmative cases, rates become comparable for some of the minority language groups. See Table 6.
| Nationality | Affirmative | Defensive | Percent Granted* | |||||||
|---|---|---|---|---|---|---|---|---|---|---|
| Total | Granted | Denied | Other* | Total | Granted | Denied | Other* | Affirmative | Defensive | |
| All | 215,184 | 134,597 | 76,972 | 3,615 | 136,714 | 40,546 | 94,349 | 1,819 | 64% | 31% |
| Albania | 5,164 | 3,360 | 1,779 | 25 | 1,591 | 904 | 676 | 11 | 66% | 58% |
| Armenia | 3,720 | 2,351 | 1,315 | 54 | 497 | 326 | 166 | 5 | 65% | 67% |
| Cameroon | 3,351 | 2,351 | 945 | 55 | 501 | 366 | 126 | 9 | 72% | 75% |
| China | 62,356 | 48,367 | 13,447 | 542 | 10,824 | 7,125 | 3,581 | 118 | 78% | 67% |
| Colombia | 16,804 | 7,040 | 9,631 | 133 | 2,160 | 721 | 1,417 | 22 | 43% | 34% |
| Cuba | 31 | 11 | 18 | 2 | 620 | 193 | 369 | 58 | 42% | 40% |
| El Salvador | 2,177 | 461 | 1,498 | 218 | 30,091 | 6,725 | 23,101 | 265 | 31% | 23% |
| Ethiopia | 4,820 | 3,775 | 974 | 71 | 903 | 706 | 177 | 20 | 80% | 80% |
| Guatemala | 5,924 | 1,140 | 4,498 | 286 | 26,284 | 5,322 | 20,742 | 220 | 24% | 21% |
| Haiti | 14,541 | 3,204 | 11,283 | 54 | 4,977 | 773 | 4,182 | 22 | 22% | 16% |
| Honduras | 579 | 186 | 369 | 24 | 22,889 | 4,394 | 18,295 | 200 | 36% | 20% |
| India | 7,831 | 5,217 | 2,498 | 116 | 1,039 | 473 | 541 | 25 | 68% | 48% |
| Indonesia | 6,352 | 2,516 | 3,733 | 103 | 1,804 | 285 | 1,471 | 48 | 41% | 18% |
| Mexico | 2,958 | 608 | 1,903 | 447 | 12,972 | 2,730 | 10,019 | 223 | 36% | 23% |
| Nepal | 4,193 | 3,318 | 826 | 49 | 346 | 233 | 107 | 6 | 80% | 69% |
| Nicaragua | 220 | 57 | 155 | 8 | 1,082 | 422 | 648 | 12 | 30% | 40% |
| Russia | 4,246 | 3,240 | 964 | 42 | 636 | 431 | 190 | 15 | 77% | 70% |
| Somalia | 1,349 | 842 | 427 | 80 | 176 | 123 | 47 | 6 | 68% | 73% |
| Venezuela | 5,193 | 2,676 | 2,454 | 63 | 1,084 | 649 | 420 | 15 | 53% | 61% |
| Other Countries | 63,375 | 43,877 | 18,255 | 1,243 | 16,238 | 7,645 | 8,074 | 519 | 71% | 50% |
| Language | Affirmative | Defensive | Percent Granted* | |||||||
|---|---|---|---|---|---|---|---|---|---|---|
| Total | Granted | Denied | Other* | Total | Granted | Denied | Other* | Affirmative | Defensive | |
| All | 62,356 | 48,367 | 13,447 | 542 | 10,824 | 7,125 | 3,581 | 118 | 78% | 67% |
| Mandarin | 44,176 | 34,563 | 9,259 | 354 | 6,066 | 4,133 | 1,858 | 75 | 79% | 69% |
| Foo Chow | 10,518 | 7,812 | 2,609 | 97 | 3,755 | 2,271 | 1,458 | 26 | 75% | 61% |
| Englilsh | 3,025 | 2,499 | 496 | 30 | 467 | 379 | 81 | 7 | 84% | 83% |
| Tibetan | 1,431 | 1,264 | 148 | 19 | 27 | 25 | 2 | 0 | 90% | 93% |
| Korean | 1,255 | 899 | 337 | 19 | 166 | 97 | 65 | 4 | 73% | 61% |
| Cantonese | 871 | 575 | 286 | 10 | 114 | 59 | 51 | 4 | 67% | 55% |
| Wenzhou | 633 | 433 | 196 | 4 | 142 | 94 | 46 | 2 | 69% | 68% |
| Other | 447 | 322 | 116 | 9 | 87 | 67 | 20 | 0 | 74% | 77% |
Multifaceted Determinants of Asylum Outcome
Many factors influence the outcome of asylum claims. Both the underlying strength of each asylum seeker's case, the process used, prevailing legal standards at the time, and the personal views and judgment that each Immigration Judge brings to the case play roles.
This report drilled into some of the factors where empirical measures are available in Immigration Court data to help illuminate how these characteristics have helped shape asylum outcomes over the past two decades.
This two-part series[10] focused on national trends. TRAC's accompanying free web-query tool allows interested readers to drill into these data further to examine how asylum decision outcomes in their state, particular Immigration Court, or specific hearing location may correspond with or differ from these national trends. Look for a new release soon of TRAC's judge-by-judge asylum decision reports updated with FY 2021 data. Past reports covering time periods from FY 1994—FY 2020 are available here.
Two brand new free web-query tools have been added to TRAC's family on Immigration Court asylum cases. The first new tool rather than focusing on asylum outcome, features trends in the receipt of asylum applications in Immigration Court. While there have been 626,927 asylum decisions on the merits on asylum applications, during this same period a much larger number of asylum applications—some 1,633,770—have been lodged with the Immigration Court over the last two decades. The new tool tracks these cases over time and reports on outcome for those that have been completed. Since not all asylum decisions are closed on their merits with an up or down definitive decision on the asylum claim, the tool includes other types of outcomes where the asylum seeker was determined to be legally permitted to remain in the U.S., or was ordered deported.
A large number—some two-thirds of a million—of asylum cases tracked in the asylum filing tool are still pending. The current number—667,229—is larger than the total number of asylum decisions (626,927) granting or denying asylum that are tracked in the asylum decision tool—a tool which encompasses over two decades of these merit decisions. These pending cases are featured in TRAC's brand new tool designed to monitor in greater detail the growing asylum case backlog.[11] Asylum cases remain a substantial portion of the overall Court's backlog of pending cases.
Footnotes
[1] Asylum decisions over the last two decades from FY 2001 through FY 2021 rendered by Immigration Judges on the merits of their asylum claims were compiled. In selecting the 19 leading nationalities, the past two decades were divided into ten two-year segments and the top ranked nationalities in each of these time periods were included. Beyond these leading nationalities analyzed in this report, detailed figures over the past two decades for each of 225 nationalities also are available and can be found here.
[2] The lone exception out of the nineteen, Indonesia, had only 30 defensive cases in FY 2021 — too few to provide a reliable basis for generalization.
[3] See, for example, TRAC's April 2021 report on languages spoken by asylum seekers in pending cases under the "Remain in Mexico" (MPP) program.
[4] Some languages—especially indigenous languages—have more than one form of spelling when the name of that language is transliterated into English, and certain spellings may carry political, cultural, or social significance. TRAC uses the language names as recorded in the Immigration Court's files.
[5] TRAC computed age based upon comparing the month and year of birth to the date the Notice to Appear (NTA) was issued.
[6] Unfortunately, EOIR data no longer systematically flags cases that are part of a family group. Using a set of indirect indicators, TRAC was successful in identifying many family groups when analyzing the relatively smaller set of families assigned to the Court's new "Dedicated Docket" initiative. See TRAC August and September reports for details.
[7] As a matter of practice, asylum seekers who cross the border unlawfully are currently typically assigned by DHS to the defensive asylum path in the Immigration Courts, even though their sole purpose for crossing was to affirmatively request asylum. The Biden administration has proposed a change in policy that would provide these asylum seekers with a hearing before USCIS asylum officers. The proposed rule change is explained by former Immigration and Naturalization Service Director Doris Meissner of the Migration Policy Institute here.
[8] Despite the many nuanced legal differences between affirmative and defensive asylum, perhaps the most important practical difference is that affirmative asylum interviews take place in an administrative, non-adversarial (or at least less adversarial) setting with an Asylum Officer and with the option of having an attorney and interpreter present, but without an opposing counsel. In contrast, defensive asylum hearings take place in an adversarial setting in Immigration Court with an Immigration Judge and an opposing attorney from Immigration and Customs Enforcement.
[9] See earlier report in this two-part series available here where this is discussed.
[10] lbid.
[11] Because some asylum applications (~1,000) which are still unresolved were filed before tracking in the asylum filing tool began, the current asylum backlog at the end of September 2021 is slightly higher than found in the asylum filing tool covering filings from FY 2001 through FY 2021.