Top Places With the Most Immigrants Recently Ordered Deported
Published Apr 23, 2024
During just the last six months, about a half million immigrants were deported by ICE or by Border Patrol agents. This does not include an additional 137,000 immigrants ordered deported in increasing numbers by immigration judges.
TRAC recently obtained case-by-case details on deportations, including location information, for those immigrants already residing in the U.S. who were deported or ordered deported. The data extends over the last decade and includes current actions through the end of March 2024. This report focuses on immigrants ordered deported after Immigration Court proceedings. Subsequent reports will examine the residential locations and characteristics of immigrants ICE has deported.
The latest case-by-case records from the Immigration Court show that Immigration Judges have issued growing numbers of removal orders for immigrants appearing before them. During the first half of FY 2024, judges ordered 136,623 immigrants deported. Compared with peak removals in FY 2019 during the prior Administration, the pace of new removal orders today is 50 percent greater. The increase in removal orders coincides with the expansion of the ranks of Immigration Judges during the current Administration.
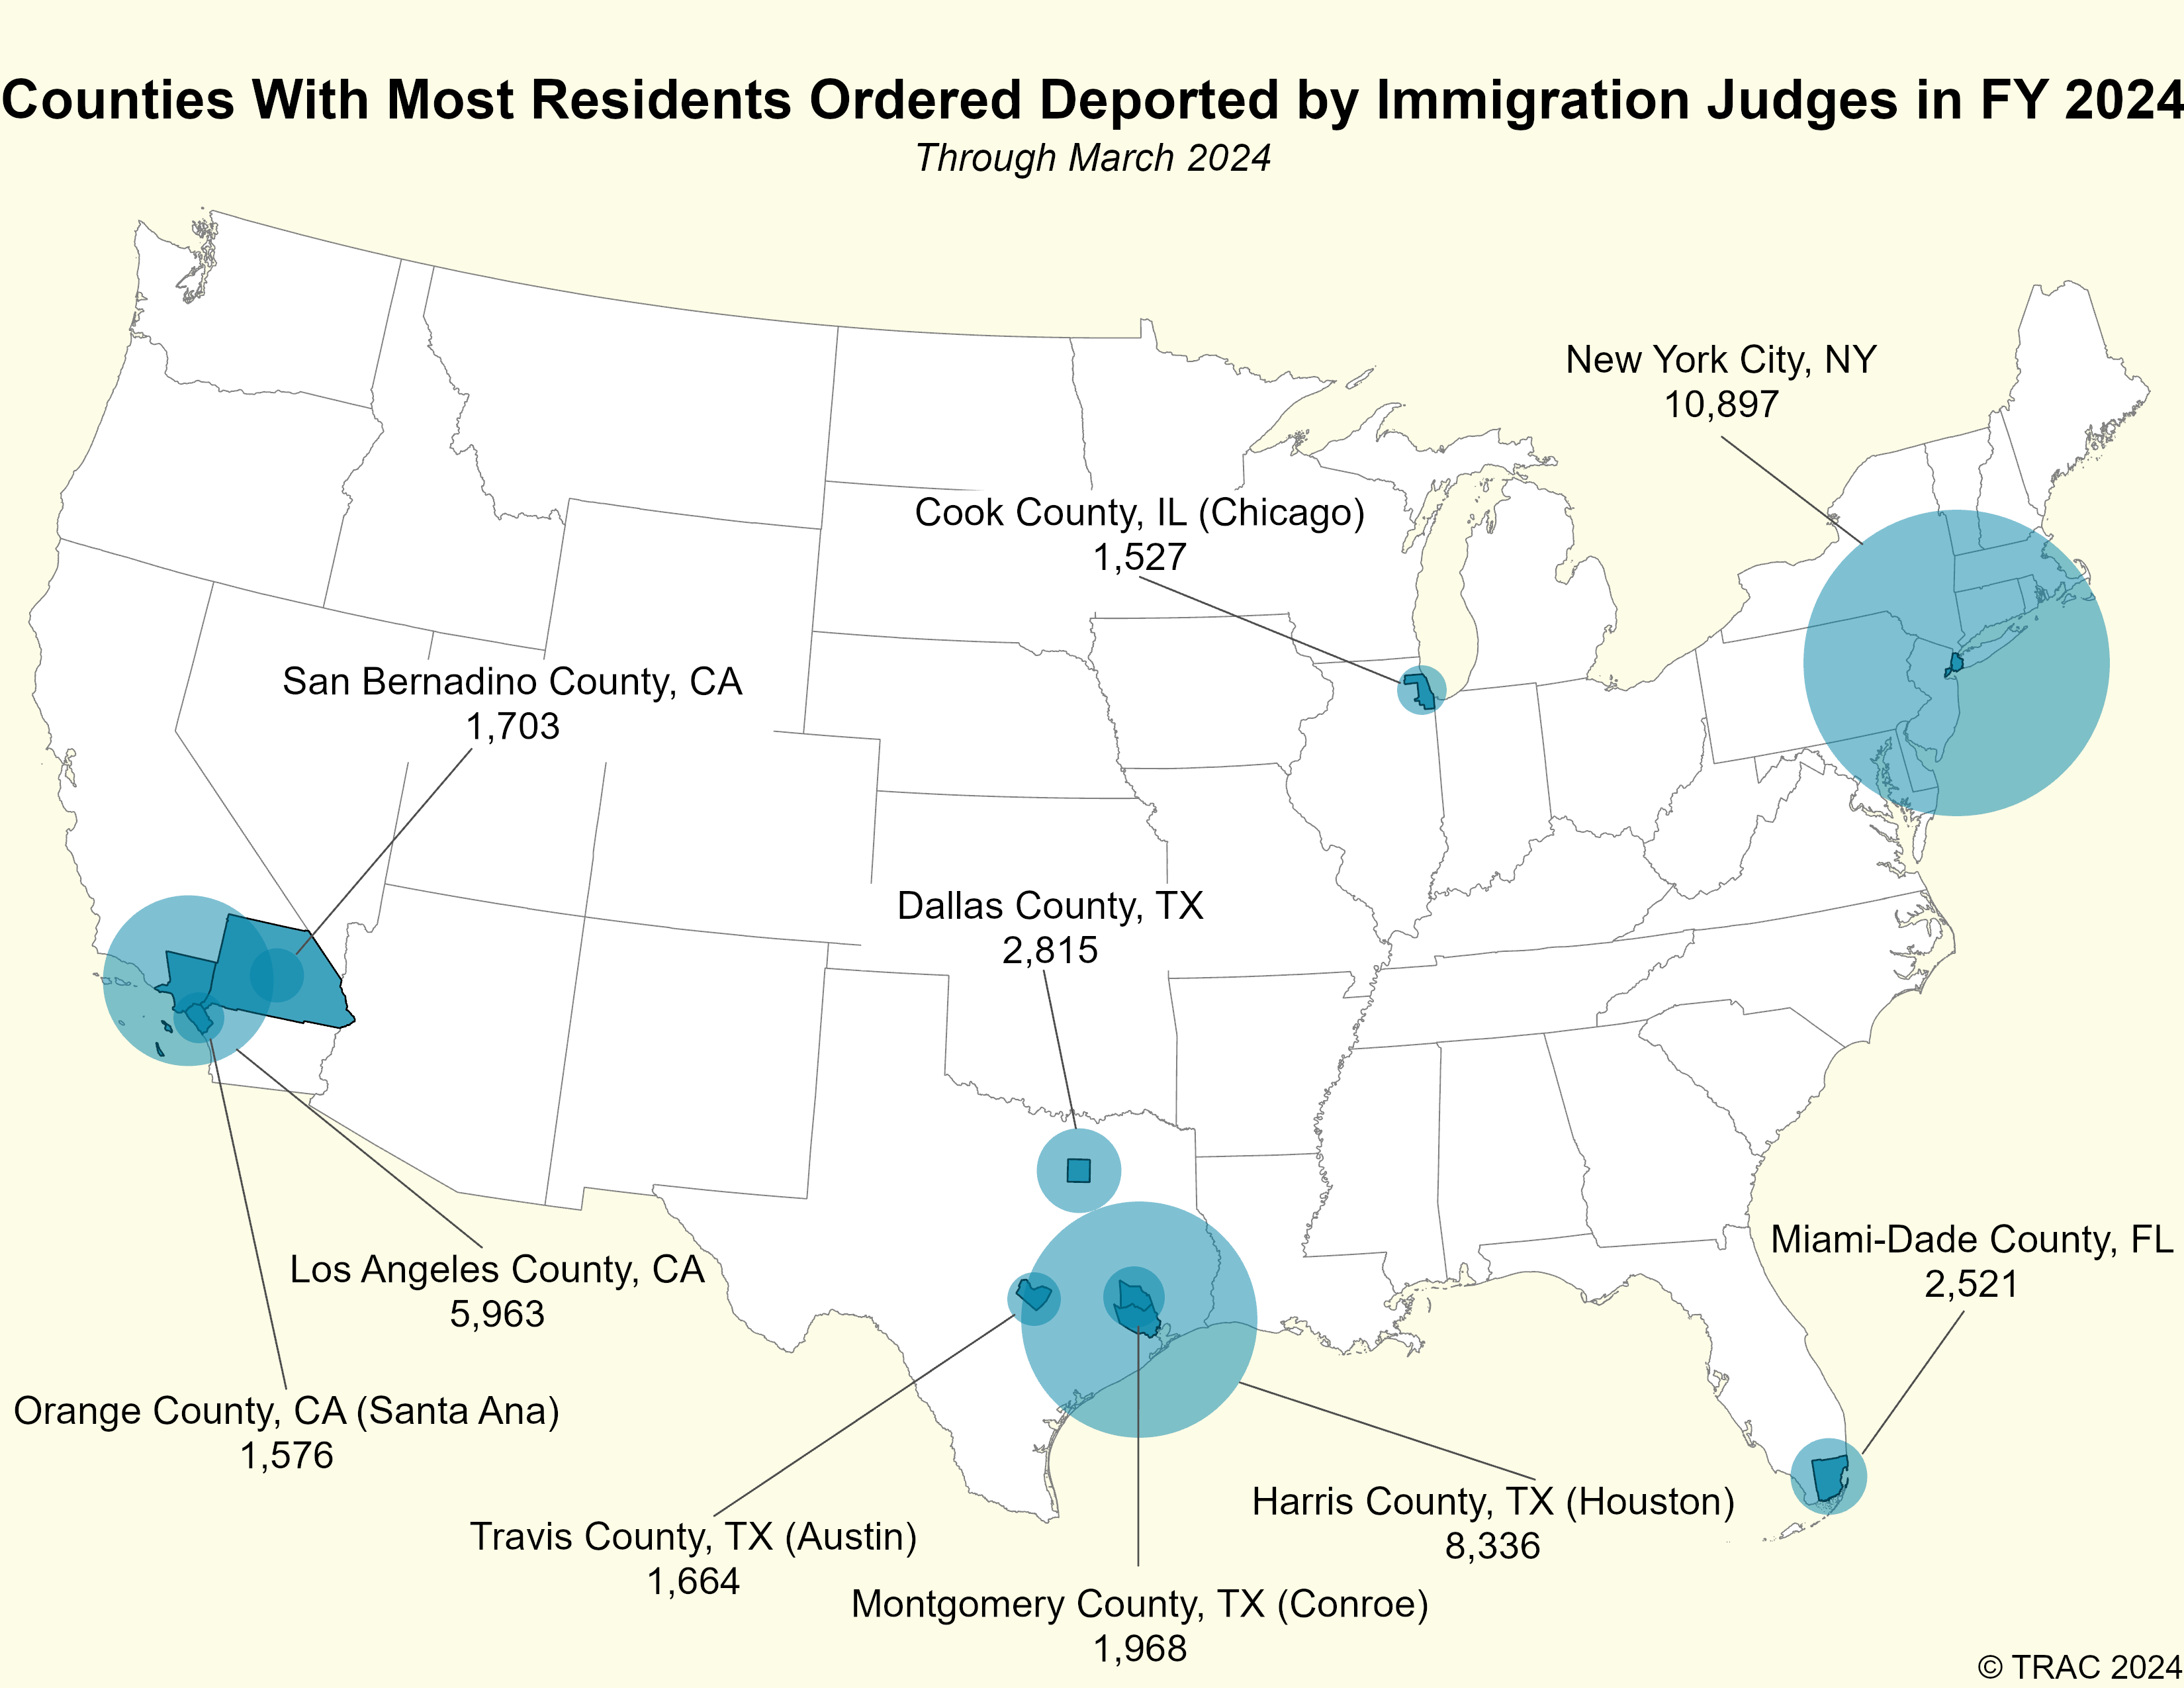
TRAC’s analysis of immigrants’ residences at the time they were ordered removed provides a detailed portrait of the areas of the country most affected. The largest number of removal orders—just under 11,000—were issued to immigrants residing in New York City. See Figure 1 and Table 1 below. The next largest group—over 8,000—were removal orders issued to immigrants in Harris County, Texas, where Houston is located. Immigrants in Los Angeles County, California, had the next largest number of residents—nearly 6,000—ordered removed.
Dallas County, Texas, followed by Miami-Dade County, Florida, had the fourth and fifth largest number of immigrants ordered removed by Immigration Judges during the last six months, but numbers were significantly lower than the top three. The 2,521 removal orders for immigrants living in Miami-Dade County were just one-fourth (23%) the number for New York City, and under half (42%) of those for Los Angeles.
The next four counties where the largest number of immigrants ordered deported lived were in Texas and California. As shown below in Table 1, Montgomery County, Texas, was the county of residence to just under 2,000 immigrants who were ordered removed. However, note that Montgomery County is the location of a large immigrant detention facility under an ICE contract with the GEO Group in which immigrants are held while awaiting their immigration hearing. San Bernardino County just east of Los Angeles in California was in seventh place with 1,700 residents ordered deported, followed by Travis County, Texas, where Austin is located with just under 1,700 of its residents ordered removed.
Orange County, California, just south of Los Angeles County, had the ninth-highest number of residents ordered deported. This means that the three contiguous counties of Los Angeles County, San Bernardino County, and Orange County were home to a combined total of over 9,000 residents who were ordered removed in the last six months – vaulting it just below New York City and above Houston in total residents who were ordered removed.
Cook County, Illinois (Chicago) was in tenth place. Although it is also a major metropolitan area and ranks high in the receipt of new asylum seekers, it had just over 1,500 of its residents ordered removed during the last six months. Its lower place in the rankings largely reflects the lower relative numbers of court cases that were completed there.
| Counties With Most Residents Ordered Deported by Immigration Judge in FY 2024* | ||||
|---|---|---|---|---|
| Whether Immigrant was Represented when Removal Ordered | ||||
| Rank | Ordered Removed | Had An Attorney | Percent with Attorney | |
| New York City, NY | 1 | 10,897 | 1,469 | 13% |
| Harris County, TX (Houston) | 2 | 8,336 | 1,382 | 17% |
| Los Angeles County, CA | 3 | 5,963 | 1,247 | 21% |
| Dallas County, TX | 4 | 2,815 | 136 | 5% |
| Miami-Dade County, FL | 5 | 2,521 | 368 | 15% |
| Montgomery County, TX (Conroe**) | 6 | 1,968 | 388 | 20% |
| San Bernardino County, CA | 7 | 1,703 | 383 | 22% |
| Travis County, TX (Austin) | 8 | 1,664 | 123 | 7% |
| Orange County, CA (Santa Ana) | 9 | 1,576 | 412 | 26% |
| Cook County, IL (Chicago) | 10 | 1,527 | 179 | 12% |
Increasingly Immigrants Unable To Find Attorneys To Contest Removal
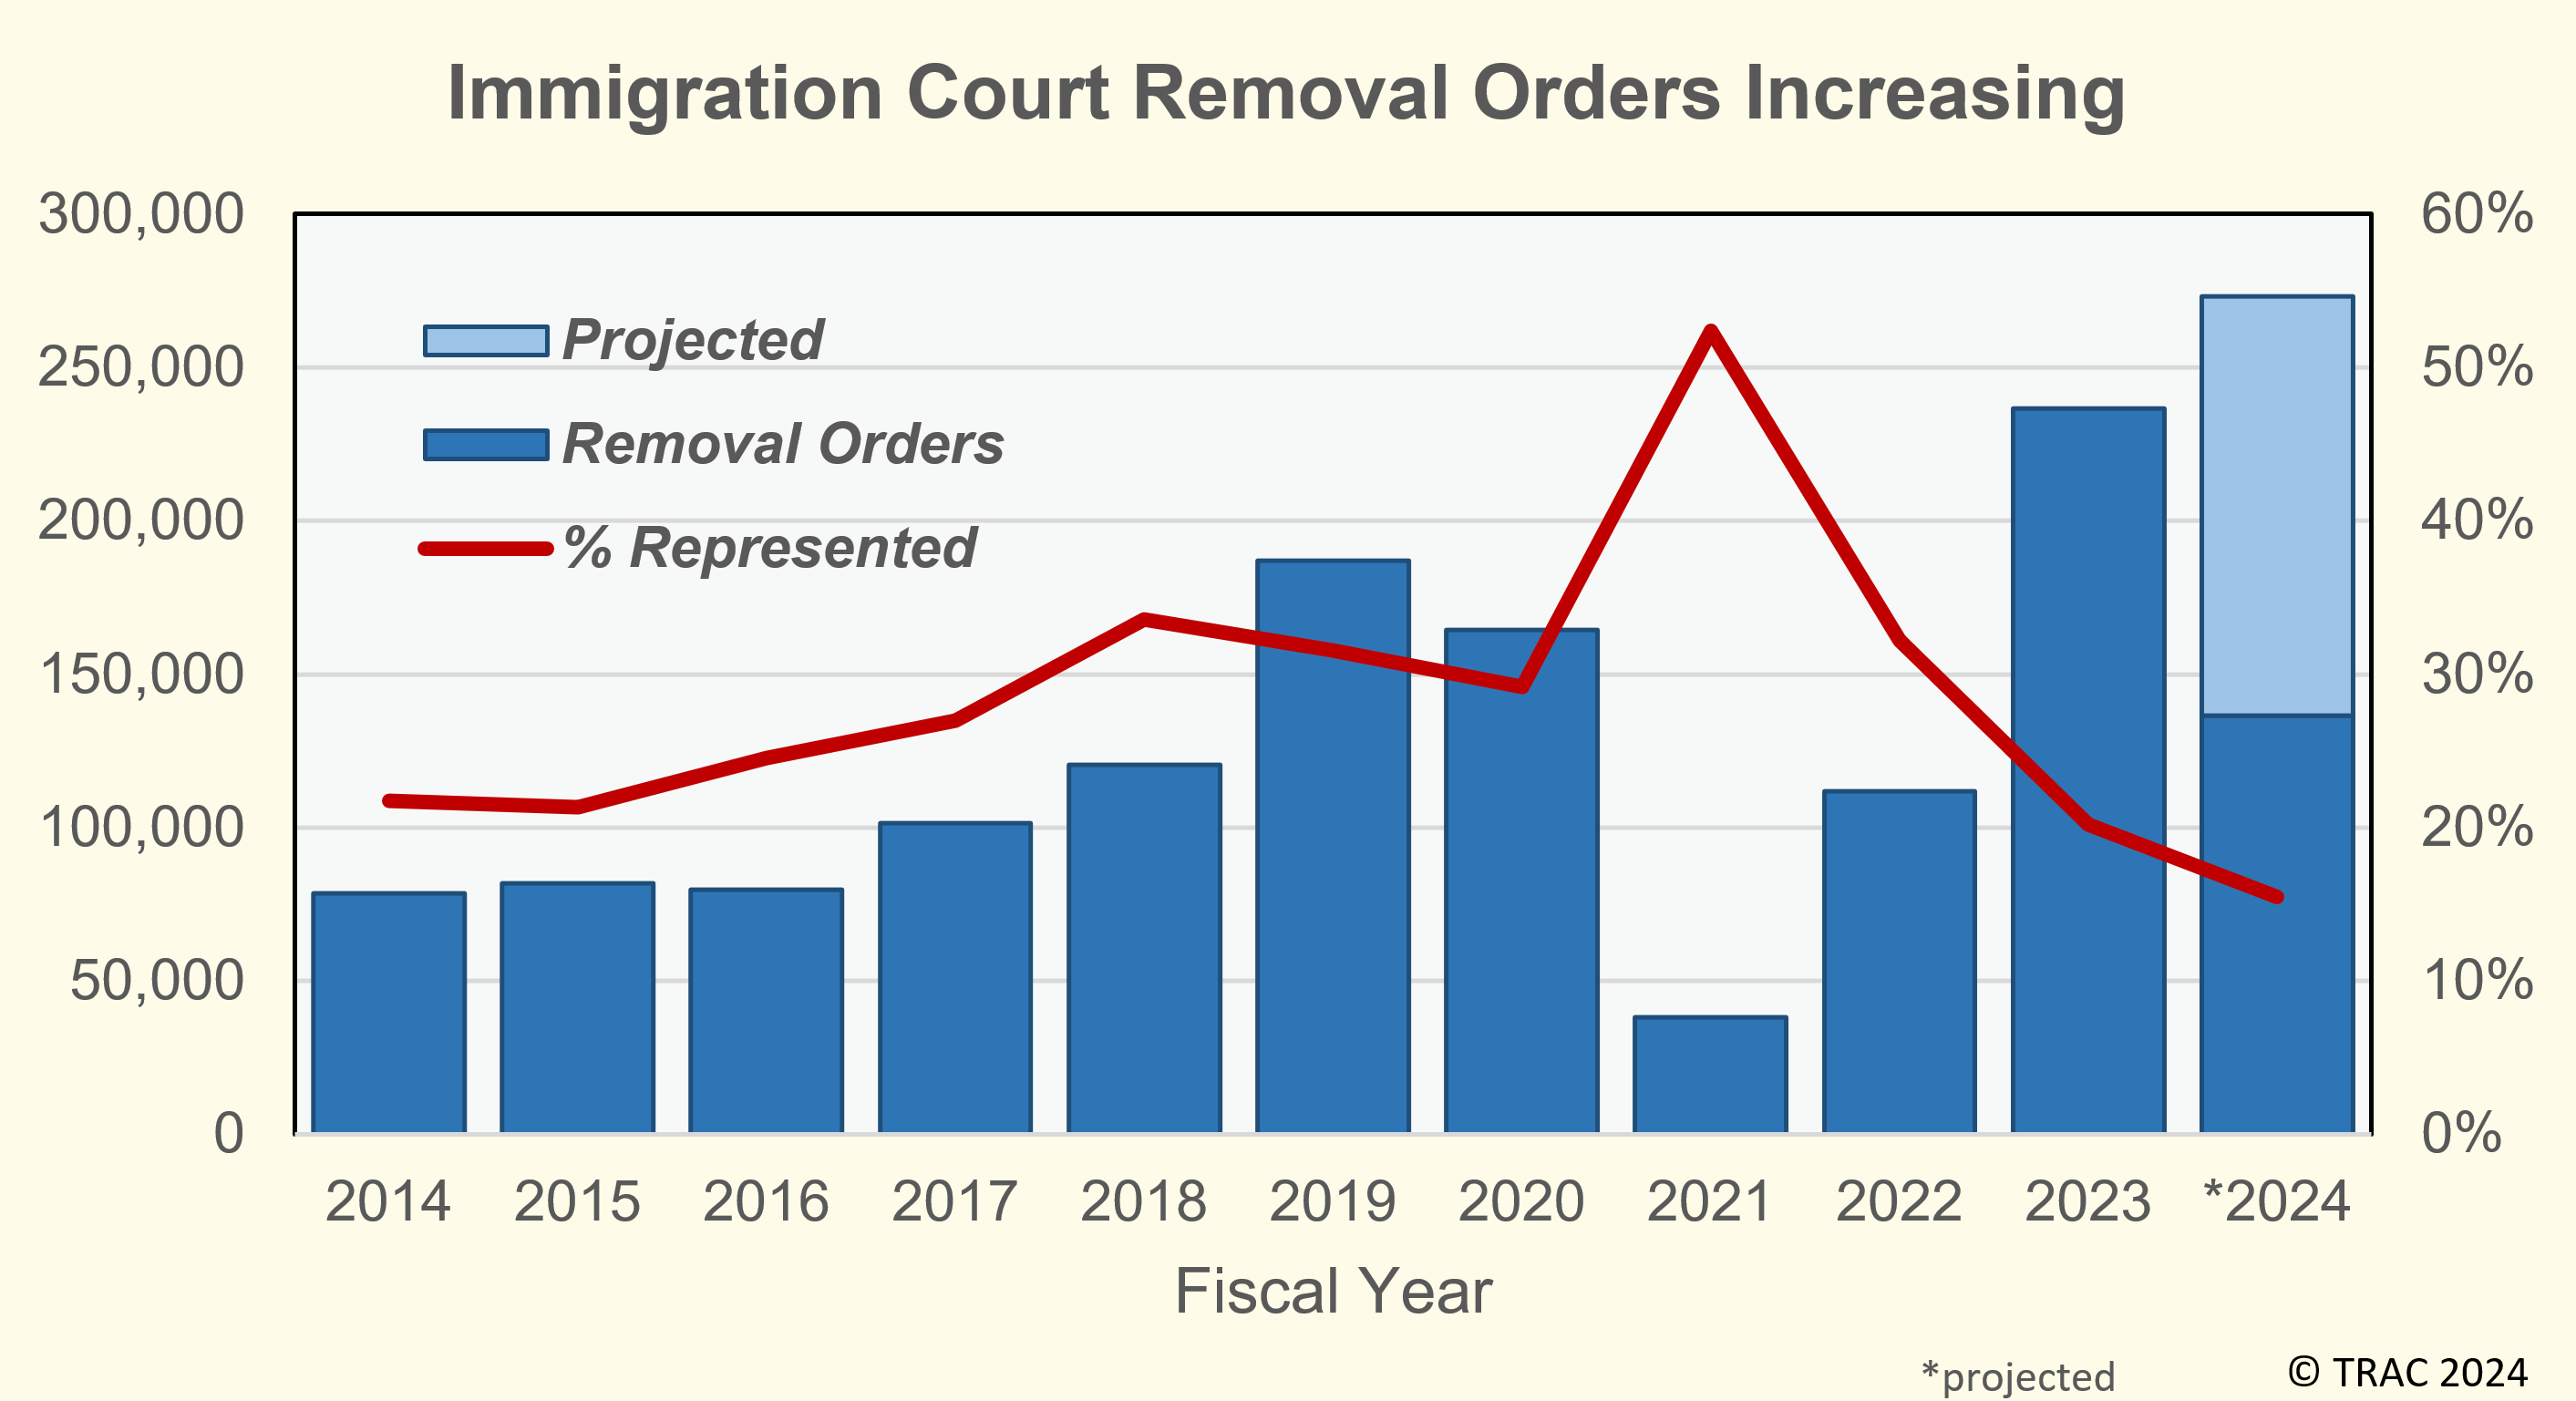
While Immigration Judges are increasing the pace of issuing removal orders, fewer immigrants ordered removed have been able to secure representation to help them present their cases. Year-by-year trends for the last decade are shown in Figure 2. From 2016 to 2019, the total number of removal decisions increased modestly accompanied by improvements in representation rates[1]. When decisions plummeted during the partial government COVID-19 shutdowns, the odds of finding representation jumped, likely because the demand for immigration attorneys to appear in court had naturally fallen as the number of hearings dropped, thereby reducing supply constraints.
Since FY 2021, representation rates have plummeted as removal hearings climbed. Last year, representation rates had fallen to only 20 percent. So far during FY 2024, only 15 percent of immigrants ordered removed had been able to obtain representation to assist them. This is considerably lower than the current rate of representation of 30 percent for all immigrants in the Court’s backlog. This is not surprising since those without attorneys generally have much higher odds of being ordered removed. And the focus here is on immigrants who have been ordered deported.
Representation rates, however, differ greatly depending on where an immigrant resides. Among the top ten counties, only 5 percent of residents in Dallas County had been represented when they were ordered removed. Austin, Texas, (Travis County) residents also had particularly low representation rates of just seven (7) percent. See Table 1 above. Chicago, Illinois, (Cook County) had below-average rates of 12 percent. And only 13 percent of New York City residents were represented when ordered removed. Other counties in the top ten had average to above-average rates. Orange County, California, south of Los Angeles, had the highest representation rate at 26 percent.
| Fiscal Year | Ordered Removed | Had an Attorney | Percent with Attorney |
|---|---|---|---|
| 2014 | 78,538 | 17,063 | 22% |
| 2015 | 81,767 | 17,424 | 21% |
| 2016 | 79,720 | 19,567 | 25% |
| 2017 | 101,469 | 27,341 | 27% |
| 2018 | 120,343 | 40,428 | 34% |
| 2019 | 187,039 | 58,971 | 32% |
| 2020 | 164,430 | 47,985 | 29% |
| 2021 | 38,021 | 19,910 | 52% |
| 2022 | 111,830 | 36,038 | 32% |
| 2023 | 236,726 | 47,816 | 20% |
| *2024 | 136,623 | 21,112 | 15% |
Asylum Seekers
On average, court cases completed during the last six months had taken over two and a half years from start to finish, with an average of 942 days. Thus, many recently completed cases actually began during the Trump administration, not the Biden administration. Cases ending in removal orders went faster (627 days on average), while those cases in which a judge granted asylum or another form of relief took 3.7 years (an average of 1,361 days).
Since many just-completed cases represent immigrants arriving at earlier points in time, their outcomes do not necessarily reflect likely future outcomes for currently arriving asylum seekers. Nonetheless, the results can be instructive.
Among all completed cases during the last six months, 38 percent had filed asylum applications, but these were highly concentrated among immigrants who had secured representation. For those immigrants filing an asylum application, only 21 percent were ordered removed. The rest—four out of five—received decisions on various other grounds that allowed them to remain in the U.S.[2]
Thus, the odds of successfully contesting a removal order often depend upon having an attorney. Most of those immigrants ordered removed had not filed formal asylum applications, even if they entered the country intending to do so. For those immigrants who were unable to file an asylum application (despite being otherwise eligible for asylum) due to lack of an attorney, they ended up ordered removed without ever having their asylum claims heard.