Too Few Immigration Attorneys: Average Representation Rates Fall from 65% To 30%
Published Jan 24, 2024
There is widespread agreement that the Immigration Court has far too few judges and support staff to handle newly arriving cases let alone process their backlog of cases which has been piling up for decades. While 1,490,480 cases were filed last year, the Court backlog at the end of December 2023 has grown to 3,287,058 cases.[1]
More judges alone won’t be sufficient. There is another serious shortage: too few immigration attorneys. As a result, the proportion of immigrants able to find an attorney to represent them in removal proceedings has dropped precipitously. Five years ago, noncitizens had found attorneys in 65 percent of all pending cases in the Court’s backlog. Today, this proportion has dropped to just 30 percent. Yet immigration attorneys are an important ingredient for assuring efficient, not just fair, court proceedings since attorneys play a vital role in alleviating a variety of administrative delays and facilitating a more functional legal process.[2] If an immigrant cannot afford an attorney, the civil Immigration Court system does not provide one as the criminal courts do for indigent defendants.
Simple math exposes the challenge of finding representation. The Court backlog has increased more than three-fold since September 2019. This also means that three times as many immigrants need attorneys. However, while the total number of immigrants with representation has increased, those who have found attorneys has only grown by 50 percent.
A shortage of immigration attorneys given this meteoric rise in demand should not be unexpected. While there are many barriers to immigrants finding representation, a shortage of available attorneys is a key constraint on why representation rates have plummeted from 65 percent down to 30 percent. See Table 1.
| Court Backlog | Immigrants with Representation | |||
|---|---|---|---|---|
| Yes | No | Percent Yes | ||
| End of FY 2019 | 1,023,767 | 660,366 | 363,401 | 65% |
| End of Dec 2023 | 3,287,058 | 987,770 | 2,299,288 | 30% |
| Change | >3.2 times | >1.5 times | >6.3 times | |
Many Immigration Court cases involve individuals, including families as well as unaccompanied children, seeking asylum. In unrepresented cases, the burden on judges “to develop the court record and to ensure a full and fair hearing to which individuals are [inherently] entitled under the Due Process Clause of the Fifth Amendment” is all the heavier.[3]
Individuals without an attorney to assist them seeking asylum before the Immigration Courts are confronted with the need to master the intricacies of U.S. immigration and asylum statutes, regulations, and court precedents, along with court procedural requirements which are usually in English. Few are able to speak or read written English. Unless they are able to find an attorney to represent them, few are able without help to successfully pursue their claim. It is well established that few unrepresented asylum seekers can even complete and file their asylum application by themselves so they never even have an opportunity to have a hearing on their claims.[4]
In fact, skilled immigration attorneys are needed to present the evidence and arguments on both sides. Presenting the government’s case is the responsibility of attorneys employed by Immigration and Custom Enforcement (ICE). Recently, citing budget constraints leading to an attorney shortage, ICE has adopted the practice of not sending an attorney to many hearings. Yet the agency may seek to reserve its right to appeal if ICE doesn’t like the decision the Court reaches in their absence, an end result which only adds to the burdens faced by the Court and the immigrant in the case.[5]
The Changing Representation Picture State-by-State
There is vast variation in representation rates across Courts headquartered in different states. In the current backlog, representation rates ranged from a high of 56 percent in Hawaii down to a low of just 14 percent in Courts based in Colorado. See Figure 1 depicting the 10 Courts with the highest representation rates [6] versus the 10 Courts with the lowest rates. See Table 2 for state-by-state numbers.
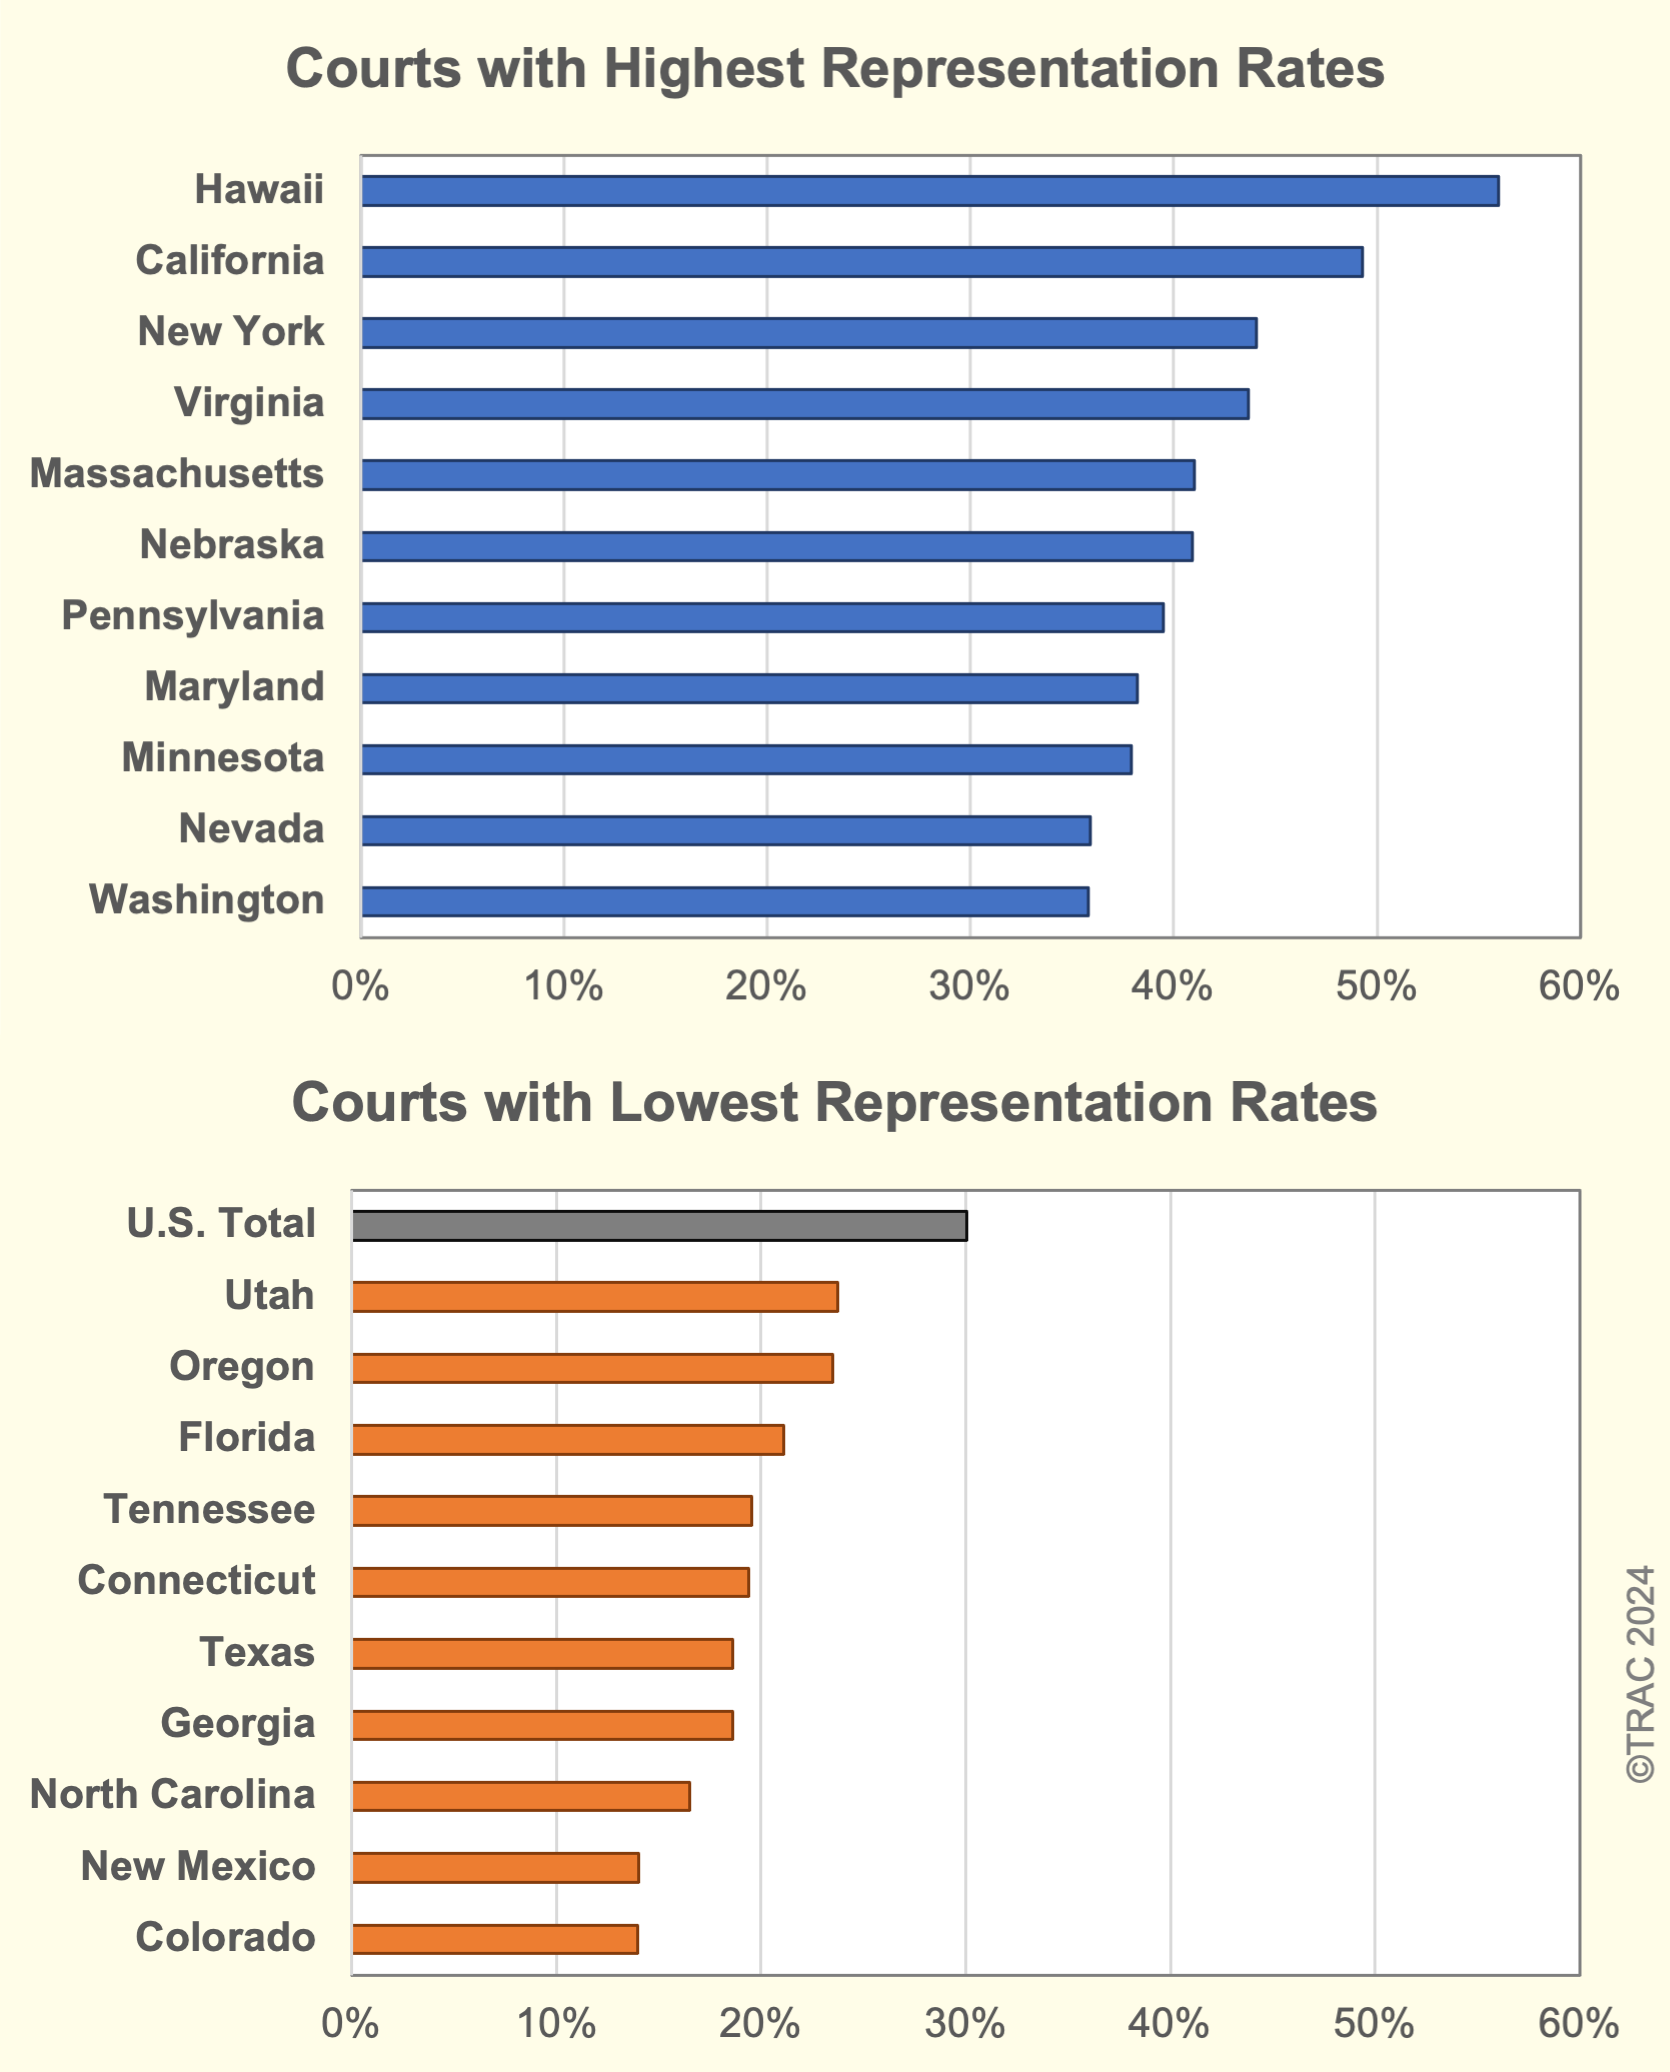
What explains this wide disparity in representation rates is only partially understood. Clearly one would expect more attorneys to be located in large cities than in smaller towns or more rural areas. But Courts headquartered in large metropolitan areas also tend to have more cases that need to be handled. California and New York centered in large population areas do have the second and third highest representation rates of 49 percent and 44 percent, respectively. However, Florida, Texas and Illinois also have major metropolitan areas where most of their cases are located. Yet representation rates in these states range between 19 percent and 25 percent – somewhere around half the representation rates found in California and New York. See Table 2.
| Immigration Court State | Case Backlog | Represented | ||
|---|---|---|---|---|
| Number | Percent | Rank | ||
| Total | 3,287,058 | 987,770 | 30% | |
| Hawaii | 911 | 510 | 56% | 1 |
| California | 348,138 | 171,547 | 49% | 2 |
| New York | 344,505 | 151,819 | 44% | 3 |
| Virginia | 83,678 | 36,550 | 44% | 3 |
| Massachusetts | 149,278 | 61,198 | 41% | 5 |
| Nebraska | 38,917 | 15,921 | 41% | 5 |
| Pennsylvania | 75,978 | 30,006 | 39% | 7 |
| Maryland | 63,330 | 24,193 | 38% | 8 |
| Minnesota | 37,986 | 14,403 | 38% | 8 |
| Nevada | 17,857 | 6,409 | 36% | 10 |
| Washington | 41,536 | 14,869 | 36% | 10 |
| Arizona | 26,597 | 9,322 | 35% | 12 |
| Michigan | 22,769 | 7,330 | 32% | 13 |
| New Jersey | 186,317 | 59,378 | 32% | 13 |
| Ohio | 47,789 | 14,905 | 31% | 15 |
| Louisiana | 56,882 | 17,704 | 31% | 15 |
| Missouri | 40,586 | 10,286 | 25% | 17 |
| Illinois | 211,096 | 52,023 | 25% | 17 |
| Utah | 39,803 | 9,447 | 24% | 19 |
| Oregon | 30,087 | 7,071 | 24% | 19 |
| Florida | 481,376 | 101,551 | 21% | 21 |
| Tennessee | 120,825 | 23,625 | 20% | 22 |
| Connecticut | 40,002 | 7,750 | 19% | 23 |
| Texas | 458,630 | 85,461 | 19% | 23 |
| Georgia | 128,256 | 23,857 | 19% | 23 |
| North Carolina | 127,427 | 21,066 | 17% | 26 |
| New Mexico | 271 | 38 | 14% | 27 |
| Colorado | 65,670 | 9,179 | 14% | 27 |
| Other* | 561 | 352 | 63% | -- |
While one might expect that states experiencing the largest relative growth in cases might be associated with the largest drop in representation rates, there is no clearcut pattern of association. There seem to be potentially a myriad of other factors at play. One source of data that is available is the absolute and relative number of cases represented by pro bono attorneys. Trends here, as TRAC previously reported, show a growth in the number of cases with pro bono representation. But as a proportion of the Court caseload, rates peaked in FY 2021 have been plummeting since.
These pro bono numbers, however, do not include all attorneys providing legal services at no charge to the immigrant, since they exclude attorneys who receive some salary support from nonprofit and government programs that have sprung up to increase the availability of representation for immigrants. The existence of these programs varies by state and locale within a state. However, there is unfortunately no comprehensive source of data on all of these efforts and their actual impact on increasing representation rates.
EOIR Bars Access to Vital Data
It is surprising that in this day and age while there are fairly precise counts of the number of Court cases with representation, there are no solid facts on the actual number of attorneys supplying this representation. This information is crucial to understanding not simply the number of immigrants with representation, but the total number of immigration attorneys providing that representation, as well. These data could show whether, and how quickly, the supply of immigration attorneys is also growing compared to the number of immigrants who need representation.
This lack of information is not because the data isn't recorded. The same systems that record whether a case is represented also identify the attorney supplying this representation. This information is recorded in Court records in two ways: first by the name and address of the attorney and second by computer-generated anonymous IDs that EOIR databases use to link cases to particular attorneys.
Unfortunately, EOIR stopped providing TRAC and other researchers with essential data identifying how many immigration attorneys are representing immigrants in its caseload or even in which state immigration attorneys are based. Even after several years of concerted effort by TRAC which teamed up with other researchers seeking to get EOIR to release these vital details, EOIR has not been willing as yet to provide even anonymous data on attorneys that would permit compiling actual counts at a national level, let alone state-by-state, of the number of attorneys who are representing immigrants in the Court and how these numbers have changed over time.
Thus, EOIR’s intransigence prevents meaningfully assessment of how policies, including its own, impact attorney supply and resultant representation rates. Take the following essential research questions that, if answered, could inform public policy and practice. Have attempts to expedite case processing times had an adverse impact on the caseloads that attorneys representing clients take on so that effectively fewer cases end up being represented in aggregate over any period of time? Have programs to suddenly change hearing schedules making workload less predictable for attorneys impacted their caseload size? Have different efforts designed to increase the supply of immigration attorneys actually increased the supply? These questions are unanswerable not because the data is not collected, but because EOIR refuses to share these data with the public.