Immigrants Pay $2 Billion in ICE Bonds Since FY 2017
Published Feb 8, 2024
Immigration and Customs Enforcement (ICE) often requires immigrants to pay a bond before releasing them from immigrant detention centers. In addition to Alternatives to Detention (ATD) monitoring, ICE uses bonds as a way of ensuring that immigrants attend their immigration court hearings and follow additional requirements set by ICE. Once a bond is posted, detained immigrants are typically released.
Based on new data obtained by TRAC through Freedom of Information Act requests, between the start of FY 2017 (October 2016) and the end of December 2023, immigrants and their obligors[1] have posted more than a quarter of a million bonds (258,438) and paid Immigration and Customs Enforcement (ICE) just over $2 billion in bond money.[2]
Figure 1 shows the total number of bonds posted each month. Most of the bonds in this study (94.0 percent) are “delivery bonds”, which require the obligor to return the individual to ICE. A smaller number of these bonds (5.6 percent) are known as “voluntary departure bonds”, which require the individual to prove that they have left the country.[3]
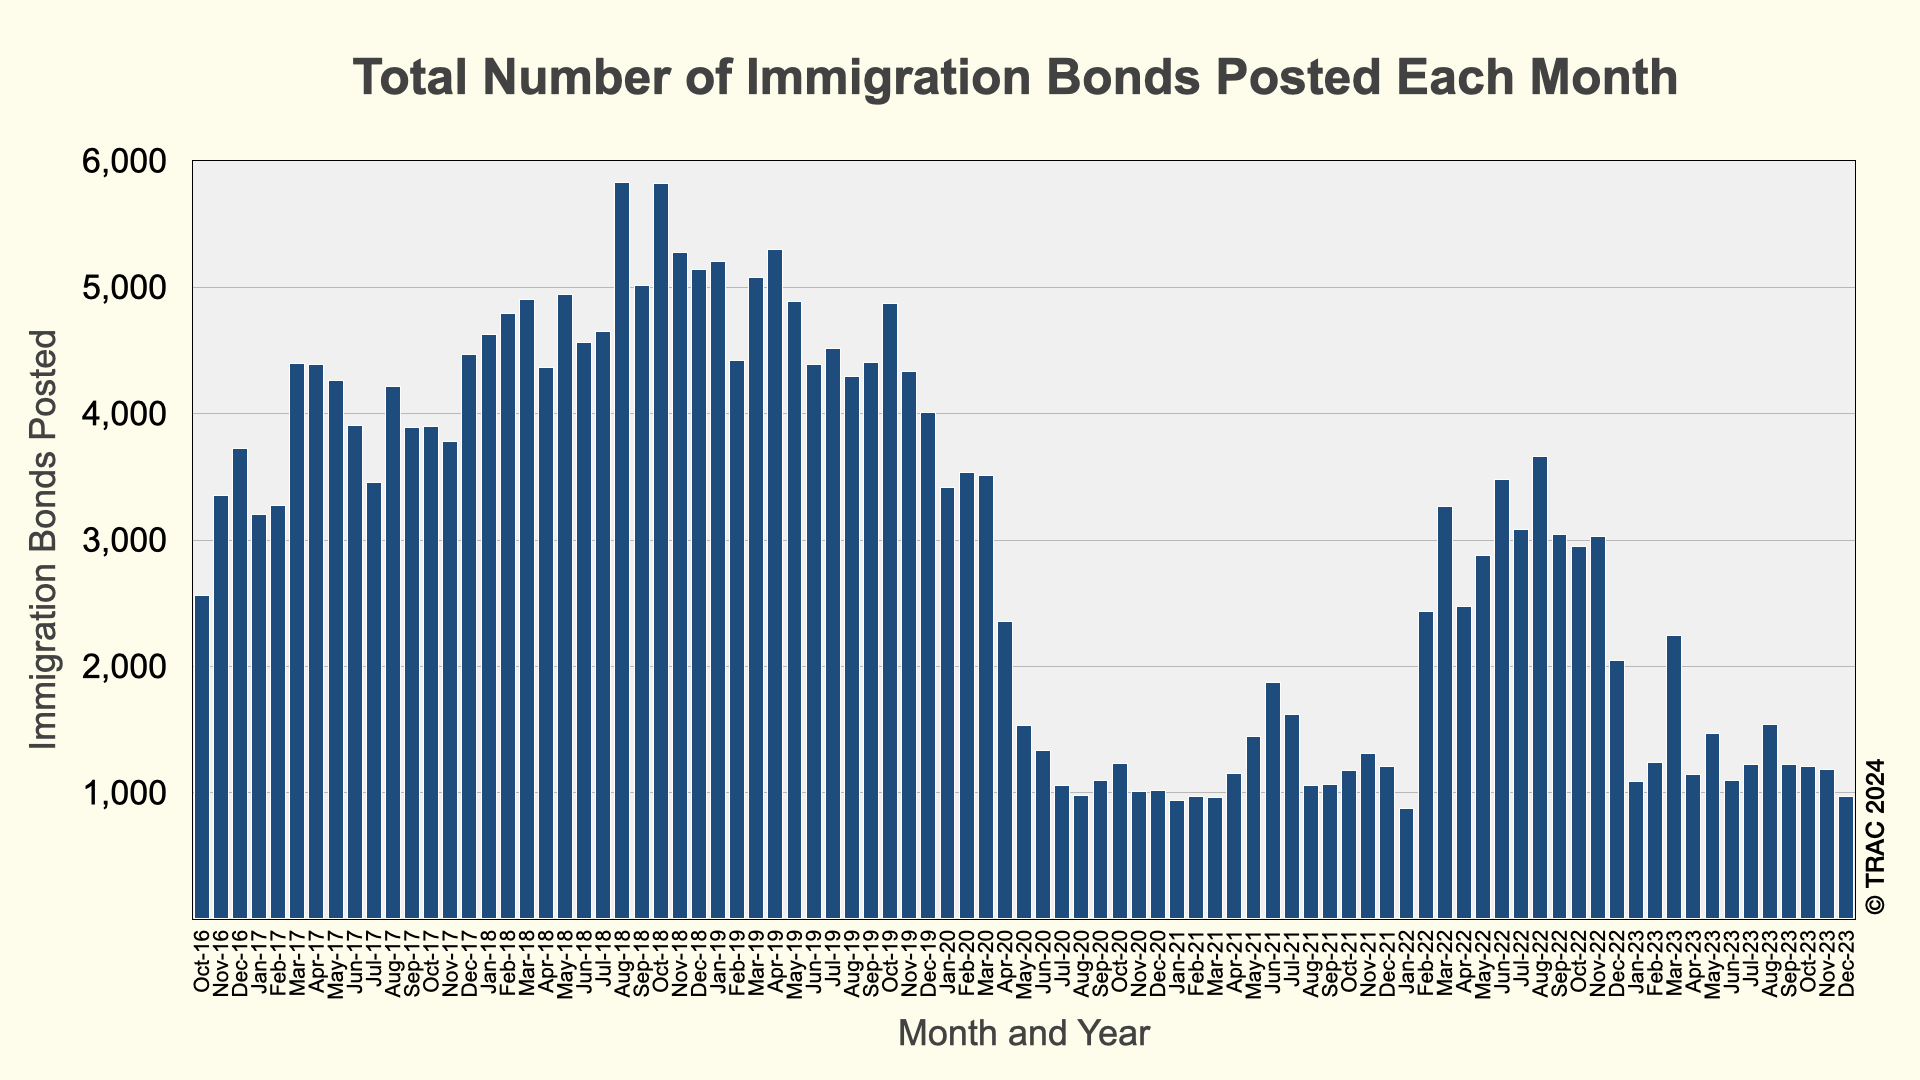
The effects of the COVID-19 pandemic are clear starting in early FY 2020. The pandemic led to a decline in detention numbers overall, and therefore logically appears to have also led to a decline in the number of people who might be eligible for bond.
Notably, however, the total number of people in detention was not the only factor driving bond numbers. The total bonds posted remained mostly low until February 2022 when they began to increase from around 1,000 per month to over 2,000 per month and reached as high as 3,662 in August 2022 before declining again by January. Over this period, ICE’s detained population increased, but not three-fold to mirror the growth of bonds posted. In mid-February 2022, ICE reported detaining 19,948 people. This number increased to 24,127 in mid-August—a relatively modest increase compared to the growth of bond numbers. By the start of 2023, the total bond numbers dropped again to just over 1,000 per month where, except for March, they remained until the end of 2023. Total posted bonds remained low even though ICE’s detained population increased throughout 2023, from 20,892 in mid-January to 36,263 in mid-December.[4]
These findings suggest that while the total detained population certainly contributed to the number of bonds posted, other factors, including policy decisions of the administration at the time, also influenced how many people were granted bond and ultimately posted bond.
Bond Amounts
Table 1 below shows the total number of bonds posted each fiscal year since 2017, as well as the median bond amounts for each year and the total amount of all bonds posted in each fiscal year.
Of the $2 billion posted for immigration bonds over seven full fiscal years and the first three months of FY 2024, about one-fourth– or $525,130,102 – was posted in FY 2019 alone. In that year, 58,763 bonds were posted, the highest number over this limited period of time, with a median bond amount of $7,500.
The total number of bonds and the aggregate bond amounts increased from FY 2017 to FY 2019, the first three years of the Trump administration, a time when detention numbers were also on the rise and reached 55,654 in August 2019 according to ICE’s detention data releases. The median immigration bond overall was $6,000, with the highest annual median of $8,000 in 2020 and the lowest annual median of $3,000 in 2022.
| Fiscal Year | Bonds Posted | Median Bond | Total Bond Amount Posted |
|---|---|---|---|
| FY 2017 | 44,682 | $7,500 | $378,454,445 |
| FY 2018 | 55,862 | $6,000 | $442,230,740 |
| FY 2019 | 58,763 | $7,500 | $525,130,102 |
| FY 2020 | 32,087 | $8,000 | $307,447,775 |
| FY 2021 | 14,398 | $5,000 | $90,950,625 |
| FY 2022 | 28,943 | $3,000 | $144,967,900 |
| FY 2023 | 20,329 | $4,000 | $112,189,050 |
| FY 2024* | 3,374 | $5,000 | $21,132,300 |
| Total | 258,438 | $6,000 | $2,022,502,937 |
Bonds by Location
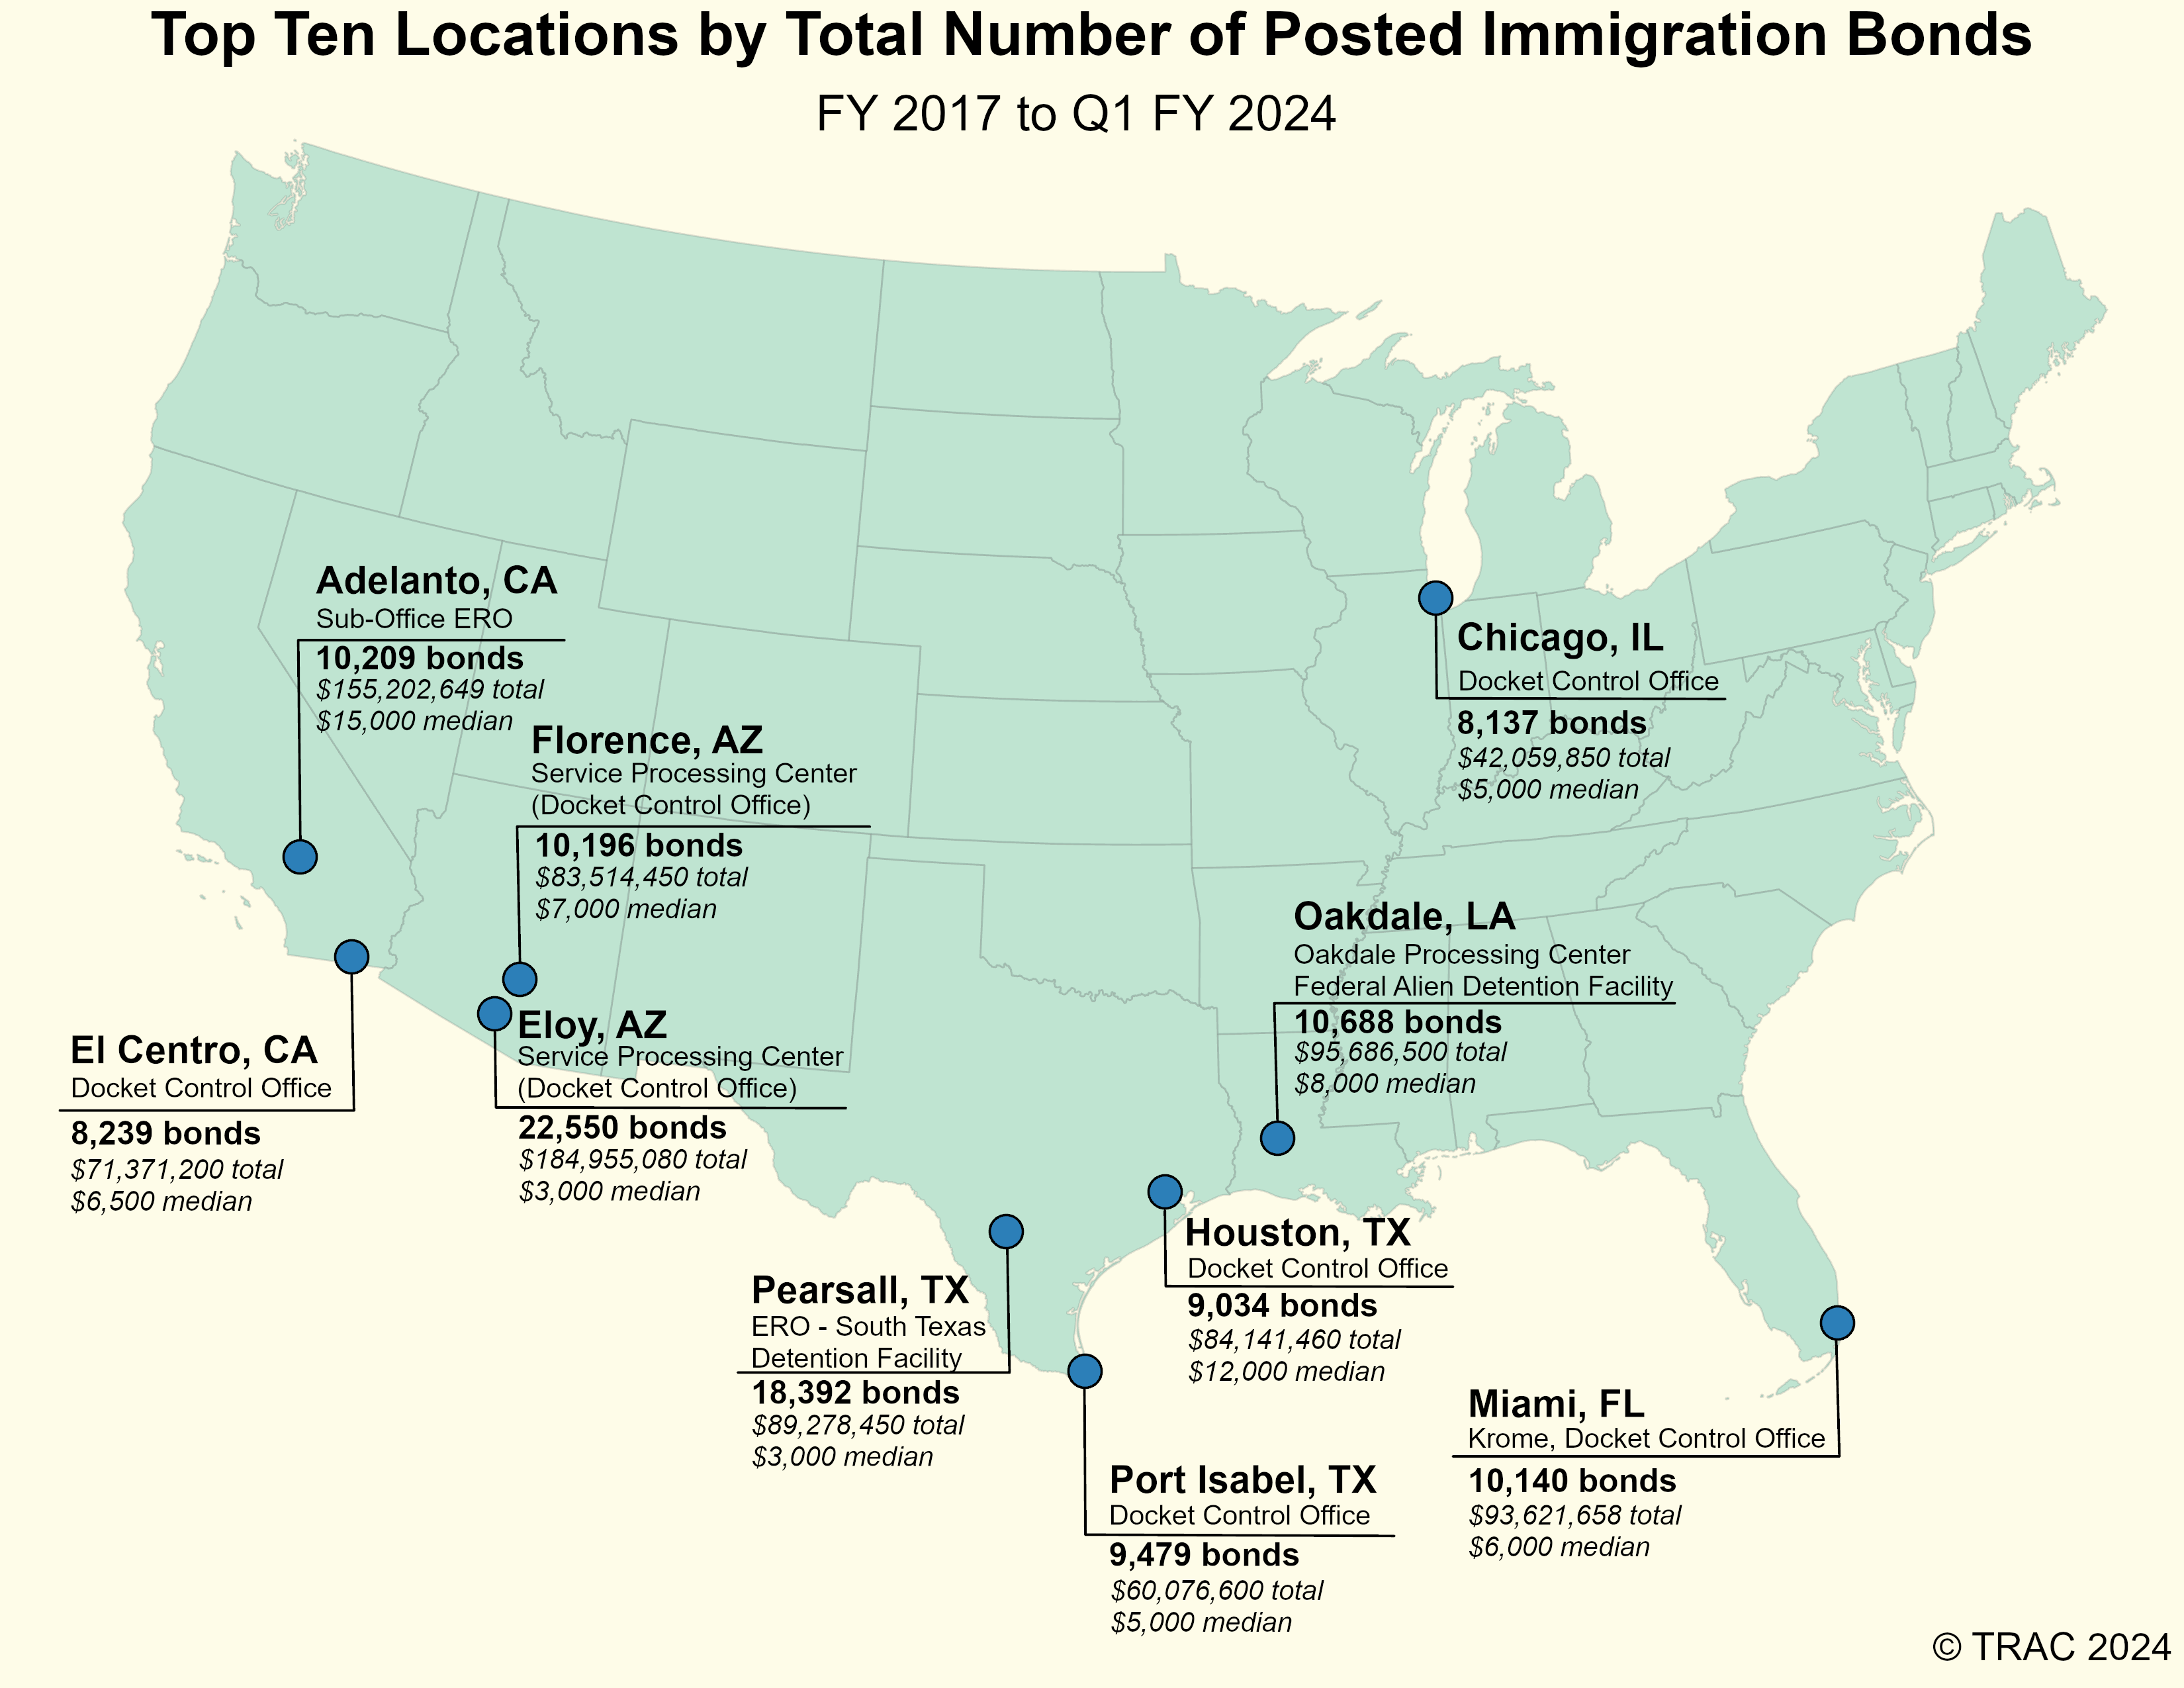
Immigration bonds typically have to be posted at one of ICE’s field offices.[5] Figure 2 shows the top 10 locations where immigration bonds were posted based on the total number of bonds over the period of these data and Table 2 provides a list of the top 25 locations for posting bond. The location with the most detention bonds posted is ICE’s detention facility in Eloy, Arizona where over 22,500 bonds have been posted since FY 2017 for a total of nearly $185 million—although the median bond amount was relatively low at $3,000 compared to other locations.
The ICE office in Adelanto, California—the same location as ICE’s Adelanto detention facility, which may be close to shutting down[6] —received over 10,000 bonds in total. This was on par with other facilities in Miami, Oakdale, and Florence, but what made Adelanto stand out was the median bond amount of $15,000—far higher than the other top facilities listed here.
| Bond Posted Site | Bonds Posted | Total Amount Posted | Median Bond Posted |
|---|---|---|---|
| Eloy, AZ | 22,550 | $184,955,080 | $3,000 |
| South Texas, TX | 18,392 | $89,278,450 | $3,000 |
| Oakdale Processing Center, LA | 10,688 | $95,686,500 | $8,000 |
| Adelanto, CA | 10,209 | $155,202,649 | $15,000 |
| Florence, AZ | 10,196 | $83,514,450 | $7,000 |
| Krome, Miami, FL | 10,140 | $93,621,658 | $6,000 |
| Port Isabel, TX | 9,479 | $60,076,600 | $5,000 |
| Houston, TX | 9,034 | $84,141,460 | $12,000 |
| El Centro, CA | 8,239 | $71,371,200 | $6,500 |
| Chicago, IL | 8,137 | $42,059,850 | $5,000 |
| Prairieland Detention Facility, Alvarado, TX | 7,864 | $50,482,700 | $5,000 |
| Atlanta, GA | 6,294 | $66,287,950 | $12,000 |
| Stewart, GA | 6,278 | $59,858,900 | $7,500 |
| CDF Denver, CO | 6,106 | $29,659,750 | $4,000 |
| Tacoma, WA | 5,689 | $76,858,900 | $10,000 |
| Hutto, TX | 5,481 | $25,496,900 | $2,500 |
| El Paso, TX | 5,100 | $29,759,250 | $5,000 |
| Washington, DC | 4,624 | $29,594,012 | $5,000 |
| Newark, NJ | 4,454 | $39,006,350 | $7,500 |
| Laredo, TX | 3,964 | $25,036,200 | $5,000 |
| York, PA | 3,936 | $31,747,750 | $7,000 |
| Montgomery County, TX | 3,803 | $37,172,500 | $10,000 |
| Las Vegas, NV | 3,798 | $20,367,650 | $5,000 |
| Batavia, NY | 3,583 | $37,256,300 | $10,000 |
| Jena, LA | 3,461 | $47,956,525 | $15,000 |