Ports of Entry Are Issuing More Notices to Appear Than Ever Before
Published Oct 11, 2023
In July 2023, Customs and Border Protection (CBP) officers at ports of entry across the United States issued a record number of Notices to Appear—44,900 in total—to immigrants who were found inadmissible under U.S. law. Noncitizens who are attempting to enter the United States may be found inadmissible for a variety of reasons, and an inadmissibility determination does not necessarily mean that the individual will not be allowed into the country on a temporary basis. However, Notices to Appear (NTAs), which put immigrants into removal proceedings within the immigration courts, were rarely used at ports of entry until the Biden administration. Unlike Border Patrol, which is responsible for immigration enforcement between ports of entry, the Office of Field Operations (OFO) is a separate agency responsible for processing people at ports of entry. According to data obtained and analyzed by the Transactional Records Access Clearinghouse (TRAC) at Syracuse University, OFO issued 280,000 NTAs in the first 10 months of FY 2023, a significant increase from 95,000 the previous year and up from about 48,000 five years ago in FY 2018.
These numbers are not only driven by an increase in the number of migrants arriving at ports of entry. OFO's use of NTAs increased in relative numbers, too. In July 2023, 45.8 percent of the 98,085 immigrants found inadmissible at ports of entry across the country (excluding crew members) were issued NTAs. Possibly more of the 30,175 immigrants who were paroled into the country in July will be issued an NTA at a later date. This is not as high as the percent of inadmissibles who were issued NTAs in the summer of 2021. In June and July 2021, 50.3 percent and 51.8 percent (respectively) of all inadmissible immigrants were issued NTAs.
The growth in OFO-issued NTAs occurred in three waves during the Biden administration. First, in the summer of 2021, OFO issued as many as 10,000 NTAs a month—a record at the time—but then declined to pre-pandemic numbers at the start of 2022. OFO’s use of NTAs resurged again in the summer of 2022, growing significantly to between 20,000 and 25,000 in late 2022 where it remained until May 2023. Coinciding with the termination of Title 42 in May 2023, the number of NTAs shot up again to a high of 44,900 in July, the month of TRAC’s most recent data. Notably, although the end of Title 42 coincided with the third and largest wave of new NTAs, OFO’s growing use of NTAs preceded the termination of Title 42 by two years.
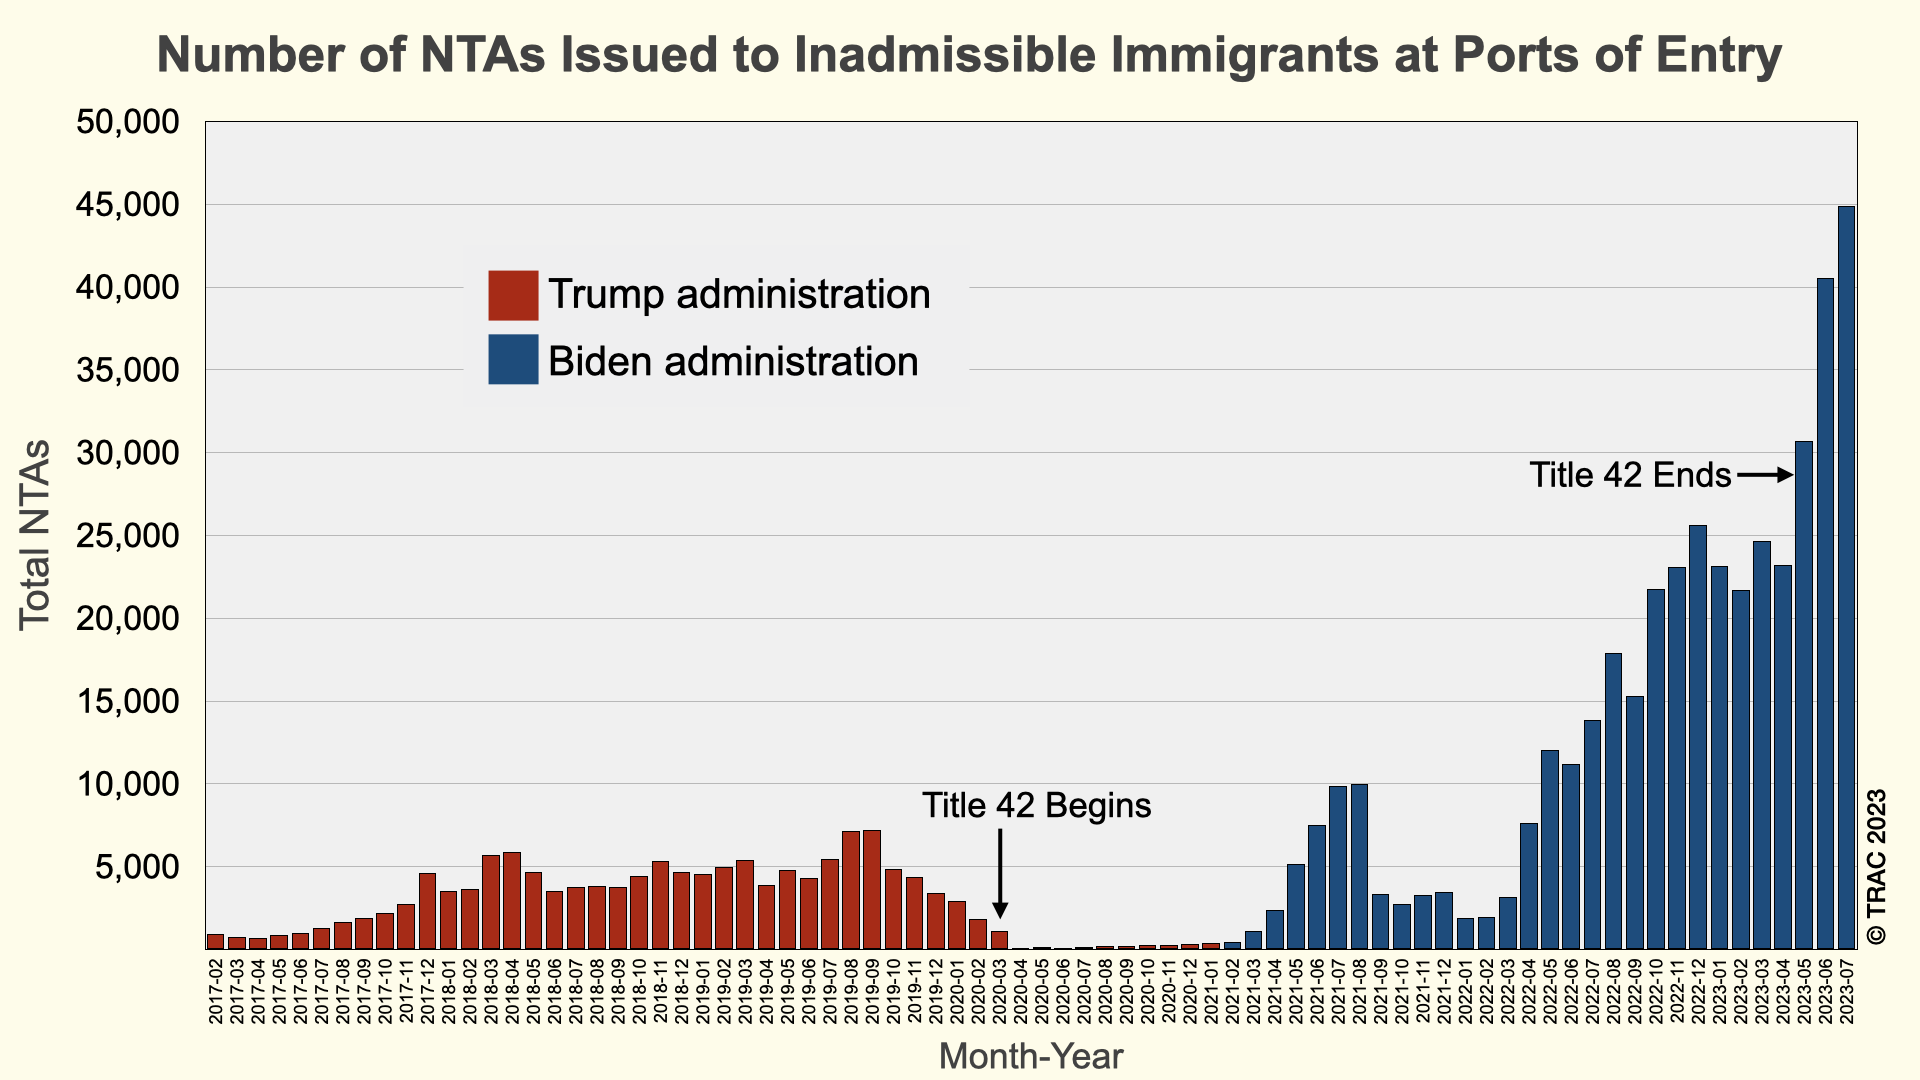
The growth of NTAs issued at ports of entry is a phenomenon that appears to be specific to the Biden administration. Roughly the same amount of NTA’s were issued at ports of entry during the Obama and Trump administrations. From February 2013 to January 2017, the span of the second Obama administration, OFO issued 125,689 NTAs. Similarly, 139,865 NTAs were issued between February 2017 to January 2021, the span of the Trump administration. OFO’s use of NTAs declined at the very start of the Trump administration, then climbed back to nearly 5,000 each month (higher than the monthly numbers during the Obama administration). OFOs use of NTAs already began to decline in 2019, but then declined to only a few hundred each month during the pandemic, when Title 42 was in place. Compared to the Obama administration, during which OFO issued 2,619 NTAs on average each month, and the Trump administration’s average of 2,914 per month. The OFO under the Biden administration has issued 13,784 NTAs per month on average so far and a total of 413,522 NTAs since February 2021.
Using TRAC’s updated inadmissibility data, which includes new detailed information on specific ports of entry, ports of entry along the U.S.-Mexico border make up the vast majority of all NTAs issued nationwide. The San Ysidro and Brownsville ports of entry each make up about one quarter of all OFO-issued NTAs so far in FY 2023. San Ysidro, just south of San Diego, California, one of the busiest land border crossings in the world, issued 71,185 NTAs from October 2022 to July 2023, which accounted for 25.5 percent of all NTAs issued by ports nationwide. The port of entry in Brownsville, Texas, in the Rio Grande Valley issued 67,894 NTAs over the same time period, which accounted for 24.3 percent of all NTAs. Other ports of entry that stand out include Hidalgo, Texas, with 50,517 OFO-issued NTAs so far in FY 2023, and El Paso, Texas, with 29,733 NTAs. These two ports of entry made up 18.1 percent and 10.6 percent (respectively) of all NTAs issued by OFO in 2023 so far. The only other ports of entry that made up more than one percent of all NTAs include Eagle Pass, Texas; Nogales, Arizona; Calexico, California; and Laredo, Texas. See Table 1 for ports of entry with at least 100 NTAs issued in FY 2023. Note that ports of entry at international airports may also issue NTAs. Additionally, data provided by CBP specifically on ports of entry is missing for 21 months, from October 2020 to June 2022.
| Port of Entry | NTA's | Percent of Nationwide |
|---|---|---|
| San Ysidro | 71,185 | 25.5% |
| Brownsville, TX | 67,894 | 24.3% |
| Hidalgo,TX | 50,517 | 18.1% |
| El Paso, TX | 29,733 | 10.6% |
| Eagle Pass, TX | 17,318 | 6.2% |
| Nogales, AZ | 12,888 | 4.6% |
| Calexico, CA | 11,345 | 4.1% |
| Laredo, TX | 10,063 | 3.6% |
| Otay Mesa | 1,720 | 0.6% |
| Del Rio, TX | 881 | 0.3% |
| Ysleta | 814 | 0.3% |
| St. Thomas (Pre-Inspection) | 743 | 0.3% |
| San Luis, AZ | 451 | 0.2% |
| Miami Intl Airport | 345 | 0.1% |
| Buffalo-Niagara Falls NY | 341 | 0.1% |
| Detroit, MI | 249 | 0.1% |
| Tecate, CA | 239 | 0.1% |
| Calexico-East | 193 | 0.1% |
| Champlain-Rouses Point | 172 | 0.1% |
| Ft Lauderdale Intl Airpt | 168 | 0.1% |
| Houston Intercontl | 160 | 0.1% |
| San Juan Intl Airport | 158 | 0.1% |
| Los Angeles Int Arpt | 155 | 0.1% |
| Chicago, IL | 142 | 0.1% |
| John F Kennedy Airport | 105 | 0.0% |
| Other | 1,328 | 0.5% |
| Total | 279,307 | 100.0% |
It may be perplexing that CBP would issue NTAs at port of entry, since, in practical terms, this could be interpreted as meaning that the government is allowing people to enter the country for the sole purpose of trying to deport them. However, in the U.S. immigration system, the Courts and Judges play a central role in adjudicating asylum applications. With a growing number of asylum seekers arriving at the U.S.-Mexico border, including at ports of entry, often the most direct path to enabling immigrants to exercise their right to apply for asylum is by putting them into the Court system. The most direct path is not necessarily the fastest; with over 2.5 million pending immigration cases and a growing number of asylum seekers, these cases typically take years to reach a final decision. (See TRAC’s most recent report on asylum seekers.) Nonetheless, the data suggest that OFO is now using NTAs more often than ever as a tool for processing asylum seekers.