Record Number of New Immigration Court Cases Arrive in August; Destinations For Asylum Seekers Shifting
Published Sep 20, 2023
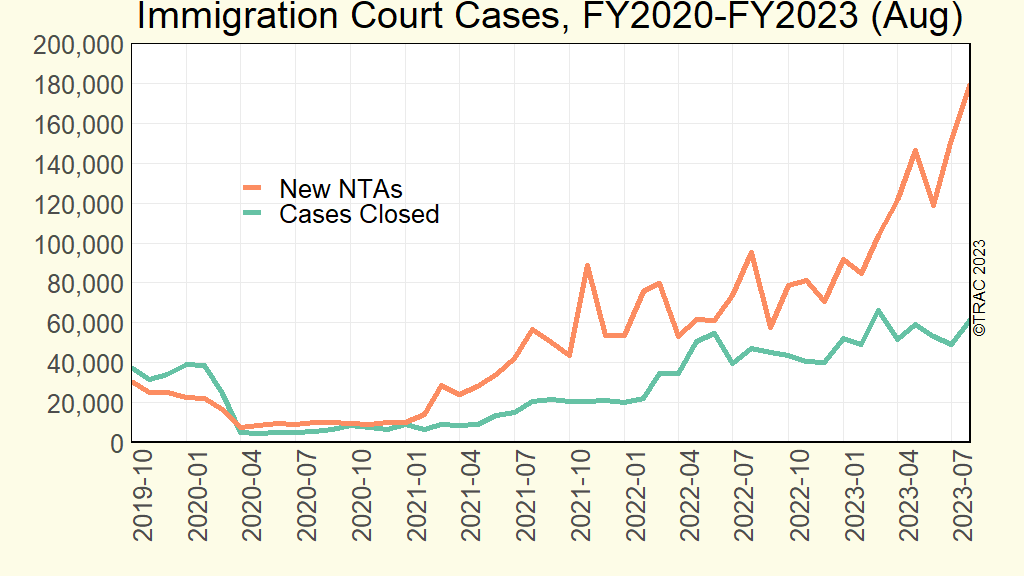
August 2023 saw a record number of new deportation cases arrive at the Immigration Court. A total of 180,065 new Notices to Appear (NTAs) arrived during August. This is a jump of 19 percent in just one month; July filings had reached a previous high of 151,910. While the growth rate of 19 percent is large, it has moderated from the 28 percent jump seen from June to July.
Thus far more than 1,230,000 new deportation cases have been added to the Court’s docket during FY 2023. All these immigrants received NTAs issued by Department of Homeland Security (DHS) officials requiring them to appear in Immigration Court and defend themselves against the government’s efforts to deport them. For many, these individuals will need to establish that they should be granted asylum or alternative forms of relief from removal.
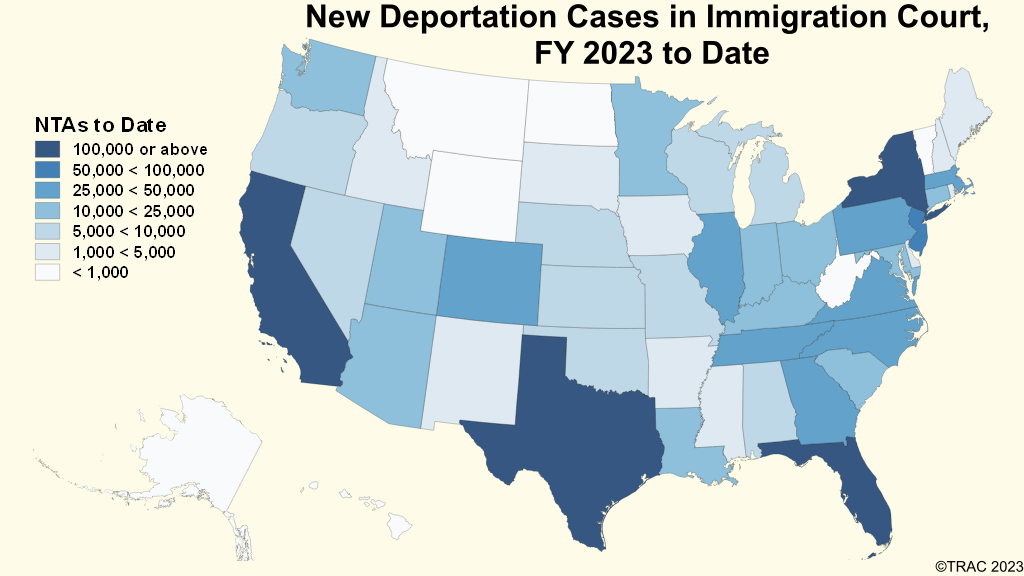
Most individuals with newly issued NTAs entered the U.S. at our country’s southwest border. Most head away from the border as soon as they can find transportation. So far all fifty states and the District of Columbia have received some of these new immigrants. Figure 1 shows state-by-state destinations.
California has received the most new immigrants with 160,297 new arrivals so far in FY 2023. But five states have each received over 50,000 new immigrants and eight more have received at least 25,000. Only California and Texas of these thirteen border the U.S.-Mexico border. The additional 11 are in alphabetical order: Colorado, Florida, Georgia, Illinois, Massachusetts, New Jersey, New York, North Carolina, Pennsylvania, Tennessee, and Virginia. See Appendix Table for state-by-state counts.
Top Destination Cities in August 2023
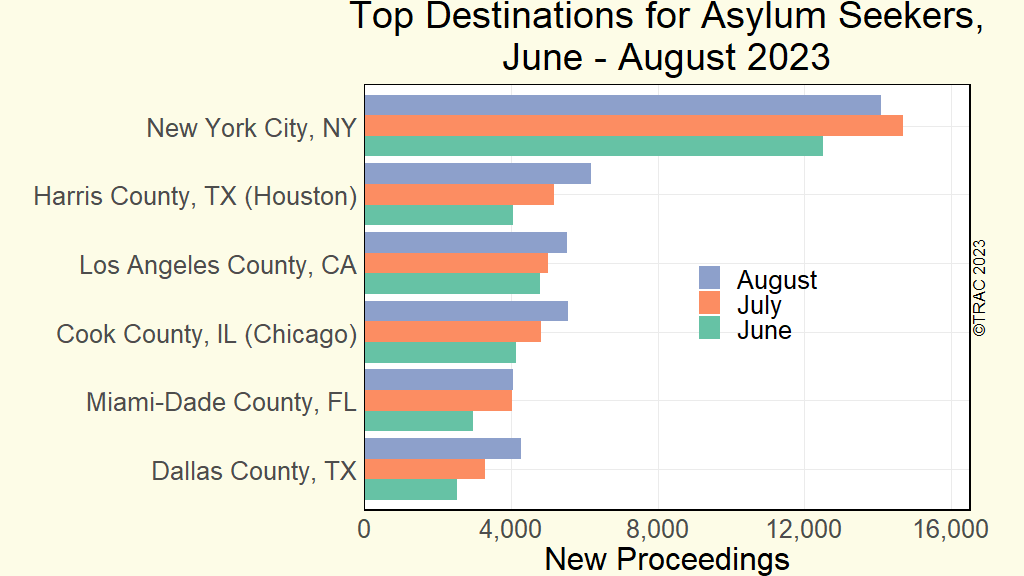
Among immigrants with new NTAs, the top destination cities in August 2023 remain largely the same as in TRAC’s June report. However, flows to these top locations have largely slowed as the destinations for more and more immigrants fan out across the country. Miami-Dade County, Florida received 4,057 of these immigrants in August, virtually the same number that came in July. In contrast, Dallas County, Texas is an example of a county that has seen faster growth. Dallas has now overtaken Miami as a destination. Miami experienced no increase in the number of arrivals during August as compared with its July arrivals, while Dallas shot up by 29 percent. See Table 1.
New York City remained the top destination city in August with 14,084 new arrivals. However, this is down 4 percent from its arrivals in July when total arrivals were 14,691. Houston, Texas now ranks second. Although far behind New York City, with 6,178 arrivals in August, it experienced 20 percent more arrivals than in July. In third place was Chicago, Illinois followed closely by Los Angeles, California. Dallas, Texas now ranks fifth among destination cities. See Figure 2 and Table 1 for arrivals during June, July, and August 2023.
| Immigrant Destination | New NTAs in 2023 for: | Growth | |||
|---|---|---|---|---|---|
| June | July | August | July vs June* | August vs July | |
| Total New NTAs | 119,027 | 151,910 | 180,065 | 28% | 19% |
| New York City, NY | 12,502 | 14,691 | 14,084 | 18% | -4% |
| Los Angeles County, CA | 4,793 | 5,014 | 5,522 | 5% | 10% |
| Cook County, IL (Chicago) | 4,154 | 4,833 | 5,553 | 16% | 15% |
| Harris County, TX (Houston) | 4,069 | 5,169 | 6,178 | 27% | 20% |
| Miami-Dade County, FL | 2,975 | 4,049 | 4,057 | 36% | 0% |
| Dallas County, TX | 2,550 | 3,314 | 4,281 | 30% | 29% |
| Other Counties | 87,984 | 114,840 | 140,390 | 31% | 22% |
As immigrants fanned out, during the past three months around 110,000 new immigrants headed to the top six cities, while over 340,000 headed to many different communities. Thirty-seven counties in eighteen (18) different states received 1,000 or more immigrants with new Immigration Court deportation cases in August alone. Beyond the states with the top destinations in Table 1, these included (in order of counties with the largest number of new immigrants) are: New Jersey, Indiana, Tennessee, Georgia, North Carolina, Arizona, Minnesota, Utah, Colorado, Maryland, Pennsylvania, Ohio, and Massachusetts. Thirty-four counties in an additional seven (7) states received 500 or more immigrants with new Court cases during August. These were Washington, Virginia, Connecticut, Nevada, Kentucky, Louisiana, and Michigan.
To examine more details on destination by either immigrant county or state, as well as by nationality, go to TRAC’s free web query tool on New Immigration Court Proceedings located here.
Court Completions Fall Farther and Farther Behind.
All Immigration Courts across the country are struggling with large backlogs. While the Executive Office for Immigration Review (EOIR) has ramped up recruiting efforts to add new Immigration Judges,[1] decades of underfunding have meant that it has been unable to make a dent in the backlog which continues to climb. It has reached 2,620,591 at the end of August.
Each month more cases arrive than the Court is able to process. And the gap is widening since arrivals have been increasingly outpacing completions, as shown in Figure 3. It is no longer possible to even estimate wait times since growing numbers of cases now are waiting without any hearing even scheduled, And some new Court initiatives to speed the processing of newly arriving cases are pushing older cases farther and farther back in line, waiting for hearings. Growing numbers of even old cases cannot be scheduled for their hearings because there is no room on the docket.
| Immigrant State Destination | New Notices to Appear During FY 2023 in: | |||
|---|---|---|---|---|
| NTAs To Date* | June | July | August | |
| All Immigrants | 1,230,095 | 119,027 | 151,910 | 180,065 |
| Alabama | 9,709 | 922 | 1,558 | 2,313 |
| Alaska | 221 | 11 | 22 | 15 |
| Arizona | 11,936 | 1,458 | 1,593 | 1,833 |
| Arkansas | 4,950 | 478 | 626 | 1,032 |
| California | 160,297 | 14,561 | 16,794 | 18,323 |
| Colorado | 27,112 | 2,479 | 2,870 | 3,769 |
| Connecticut | 13,439 | 941 | 1,491 | 1,810 |
| Delaware | 3,138 | 341 | 450 | 540 |
| District of Columbia | 2,363 | 231 | 271 | 353 |
| Florida | 150,346 | 12,363 | 15,756 | 17,901 |
| Georgia | 37,284 | 4,092 | 5,334 | 6,146 |
| Hawaii | 455 | 42 | 75 | 94 |
| Idaho | 4,578 | 299 | 340 | 437 |
| Illinois | 49,785 | 5,756 | 6,490 | 7,621 |
| Indiana | 18,412 | 2,034 | 2,652 | 3,070 |
| Iowa | 4,733 | 432 | 638 | 791 |
| Kansas | 5,437 | 507 | 634 | 909 |
| Kentucky | 11,845 | 1,026 | 1,318 | 1,731 |
| Louisiana | 17,527 | 1,513 | 2,214 | 2,904 |
| Maine | 3,665 | 222 | 130 | 149 |
| Maryland | 21,319 | 2,161 | 2,740 | 3,994 |
| Massachusetts | 37,888 | 3,328 | 3,920 | 4,154 |
| Michigan | 8,890 | 893 | 1,183 | 1,527 |
| Minnesota | 13,897 | 1,254 | 1,769 | 2,173 |
| Mississippi | 3,474 | 342 | 469 | 638 |
| Missouri | 7,334 | 665 | 895 | 1,161 |
| Montana | 479 | 29 | 76 | 106 |
| Nebraska | 5,392 | 423 | 546 | 840 |
| Nevada | 7,839 | 706 | 920 | 1,045 |
| New Hampshire | 1,094 | 90 | 92 | 117 |
| New Jersey | 61,834 | 5,186 | 5,795 | 7,183 |
| New Mexico | 3,077 | 264 | 352 | 511 |
| New York | 145,870 | 15,662 | 19,031 | 19,297 |
| North Carolina | 27,977 | 2,726 | 4,077 | 5,224 |
| North Dakota | 524 | 57 | 75 | 91 |
| Ohio | 21,741 | 2,416 | 3,021 | 2,904 |
| Oklahoma | 6,887 | 795 | 962 | 1,138 |
| Oregon | 6,745 | 757 | 890 | 1,115 |
| Pennsylvania | 27,303 | 2,314 | 3,045 | 3,090 |
| Puerto Rico | 273 | 17 | 4 | 9 |
| Rhode Island | 3,372 | 295 | 400 | 501 |
| South Carolina | 16,091 | 1,291 | 1,844 | 2,525 |
| South Dakota | 1,198 | 83 | 159 | 203 |
| Tennessee | 25,329 | 2,636 | 3,791 | 4,884 |
| Texas | 139,432 | 15,108 | 19,503 | 23,700 |
| Utah | 16,181 | 1,231 | 1,408 | 1,907 |
| Vermont | 269 | 12 | 33 | 40 |
| Virginia | 25,413 | 2,634 | 3,577 | 4,455 |
| Washington | 17,906 | 1,858 | 2,128 | 2,155 |
| West Virginia | 473 | 39 | 65 | 79 |
| Wisconsin | 7,159 | 689 | 1,005 | 1,090 |
| Wyoming | 392 | 35 | 36 | 42 |