Weapons Convictions Under Biden Are At Record High Levels
Published Mar 24, 2023
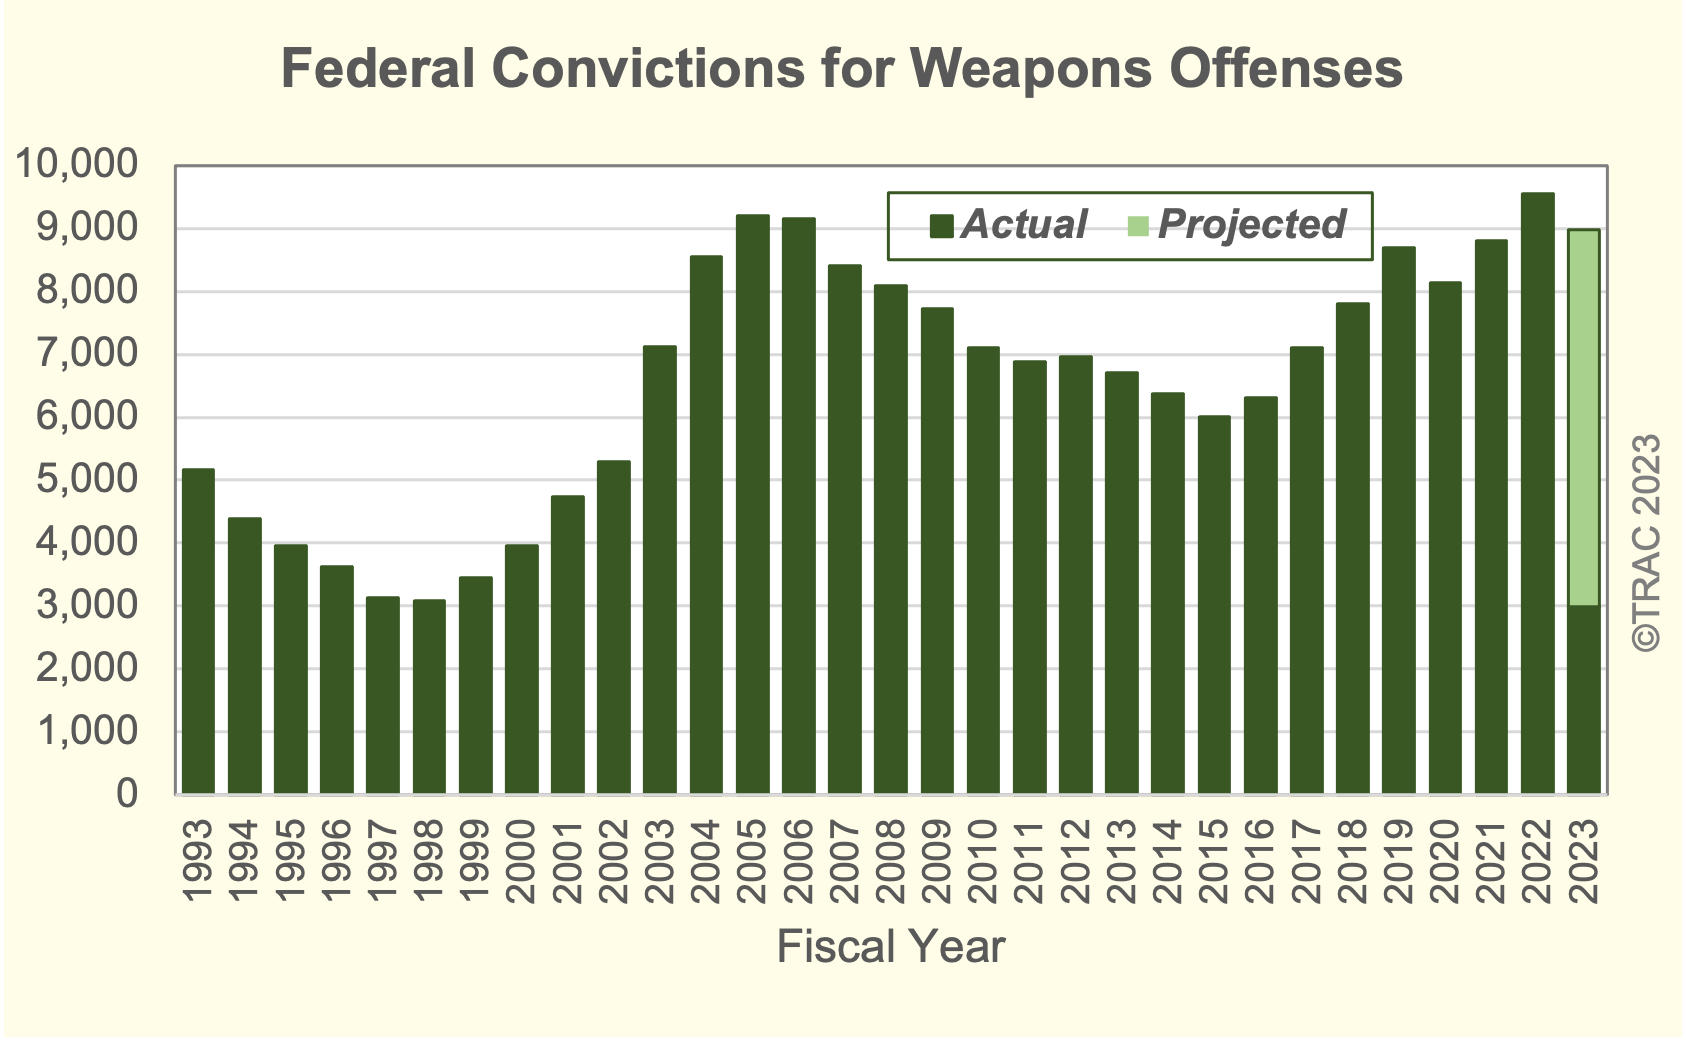
The latest available data from the Justice Department show that during January 2023 the government reported 992 new federal weapons convictions. According to the case-by-case information analyzed by the Transactional Records Access Clearinghouse (TRAC), this number is up from 731 convictions the previous month. And if the current pace continues for the rest of this fiscal year, convictions for weapons offenses would reach just under 9,000.
Convictions for federal weapons violations have undergone substantial change over the last four decades. See Figure 1. Starting from a low of around 3,000 in FY 1998, they climbed to a high in FY 2005 of 9,200 before falling to a new low of just 6,000 a decade later in FY 2015. Since then, federal convictions have generally climbed.
During the Trump administration, convictions reached 8,697 in FY 2019, then climbed even further under President Biden. Convictions reached an all-time high last year (FY 2022) when they reached 9,559. This was the largest number in any single year since recording began. So far during the Biden administration conviction levels have averaged about 15 percent higher than those during the Trump administration. See Figure 1.
The comparisons of the number of defendants convicted for weapons-related offenses are based on case-by-case information obtained by TRAC from the Executive Office for United States Attorneys after a successful lawsuit ordering release under the Freedom of Information Act (FOIA).
Investigatory Agencies and Statutes Used
The lead federal investigative agency for weapons offenses is the Bureau of Alcohol, Tobacco, Firearms and Explosives (ATF). So far in FY 2023, ATF referrals accounted for 60 percent of weapons convictions. The Federal Bureau of Investigations was responsible for another 16 percent of referrals that led to these convictions. In third place were referrals from state and local law enforcement agencies which accounted for another 9 percent. The Drug Enforcement Administration and the Department of Homeland Security were the lead investigative agencies which accounted for many of the remaining convictions for federal weapons violations.
Prohibited firearms activity under Title 18 Section 922 accounted for 83 percent of convictions so far this year. The next two statutes accounting for the most weapons convictions were Title 18 Section 1951 (Hobbs Act) for the actual or attempted robbery or extortion affecting interstate or foreign commerce, and Title 21 Section 841 for prohibited drug activity. They each accounted for an additional 3 percent of all weapons convictions during the first four months of FY 2023.
Top Ranked Judicial Districts
Generally federal weapons prosecutions and convictions are not concentrated in districts with the largest urban centers. Quite the opposite. With the exception of the Eastern District of Missouri where Detroit is located which had both the highest number as well as the highest rate relative to its population size, during the first four months of FY 2023, other major metropolitan areas ranked towards the bottom. Justice Department's case-by-case records show that New York South where Manhattan is located ranked 80th out of the 90 federal districts covering the 50 states. Los Angeles (California Central) ranked 83rd, Brooklyn (New York East) ranked 85th, Massachusetts ranked 86th, and California North where San Francisco is located ranked 87th.
In contrast, relative to their population size, the rate of criminal convictions for weapons offenses in the rest of the top five after Missouri East, were in rank order: Tennessee West (Memphis), New Mexico, the Southern District of Alabama (Mobile), and the Northern District of Iowa (Cedar Rapids). Table 1 provides a full list of the 90 districts along with the number and rate of weapons convictions plus each district’s ranking so far in FY 2023.
This also meant that two federal district judges in Western Tennessee were among those sentencing the most defendants for weapons violations compared with any other federal district court judge across the country. Federal prosecutor records for January 2023 recorded 14 criminal defendants sentenced by Judge John Thomas Fowlkes, Jr. in Memphis. Right behind, also in Memphis, was Judge Tomas Lee Robinson Parker who was recorded as sentencing 13 criminal defendants during this same period. That placed them 2nd and 3rd among judge rankings on defendants sentenced for weapons offenses.
| Federal District | Number | Rate* | Rank |
|---|---|---|---|
| Mo, E | 177 | 60.58 | 1 |
| Tenn, W | 78 | 49.95 | 2 |
| N Mexico | 83 | 39.23 | 3 |
| Ala, S | 32 | 37.18 | 4 |
| Iowa, N | 44 | 33.00 | 5 |
| Ark, E | 52 | 31.81 | 6 |
| Montana | 35 | 31.70 | 7 |
| W Virg, N | 27 | 29.25 | 8 |
| Iowa, S | 51 | 27.42 | 9 |
| Alaska | 18 | 25.67 | 10 |
| Ala, M | 28 | 23.59 | 11 |
| Utah | 74 | 22.17 | 12 |
| N Car, E | 84 | 20.43 | 13 |
| Mo, W | 65 | 20.02 | 14 |
| W Virg, S | 17 | 19.77 | 15 |
| Miss, S | 36 | 19.42 | 16 |
| Tenn, E | 51 | 18.83 | 17 |
| S Dakota | 16 | 18.14 | 18 |
| Texas, N | 119 | 15.79 | 19 |
| Texas, W | 119 | 15.53 | 20 |
| D. C. | 10 | 14.92 | 21 |
| La, W | 30 | 14.26 | 22 |
| N Dakota | 11 | 14.19 | 23 |
| N. Y., W | 40 | 14.17 | 24 |
| Ind, S | 59 | 14.15 | 25 |
| Ohio, N | 81 | 14.13 | 26 |
| Vermont | 9 | 13.94 | 27 |
| Ga, S | 22 | 13.54 | 28 |
| Ill, S | 16 | 13.03 | 29 |
| Fla, N | 25 | 13.00 | 30 |
| Ken, E | 28 | 12.56 | 31 |
| Okla, W | 27 | 12.48 | 32 |
| N Car, M | 38 | 12.31 | 33 |
| Ken, W | 28 | 12.28 | 34 |
| Miss, N | 13 | 11.86 | 35 |
| Ind, N | 30 | 11.38 | 36 |
| Arizona | 76 | 10.44 | 37 |
| Wyoming | 6 | 10.37 | 38 |
| Wash, E | 17 | 10.09 | 39 |
| Nebraska | 19 | 9.68 | 40 |
| La, E | 16 | 9.59 | 41 |
| Texas, E | 40 | 9.37 | 42 |
| Nevada | 29 | 9.22 | 43 |
| Delaware | 9 | 8.97 | 44 |
| Tenn, M | 24 | 8.87 | 45 |
| Maryland | 53 | 8.60 | 46 |
| Mich, W | 30 | 8.46 | 47 |
| Fla, S | 62 | 8.35 | 48 |
| N Car, W | 28 | 8.35 | 48 |
| Ill, C | 18 | 8.35 | 48 |
| Conn | 30 | 8.32 | 51 |
| S Car | 43 | 8.28 | 52 |
| Okla, N | 9 | 8.26 | 53 |
| La, M | 7 | 8.22 | 54 |
| Penn, W | 30 | 8.06 | 55 |
| Ala, N | 24 | 8.02 | 56 |
| Maine | 11 | 8.02 | 56 |
| Ga, M | 16 | 7.75 | 58 |
| Ga, N | 49 | 6.89 | 59 |
| Virg, W | 15 | 6.83 | 60 |
| Penn, M | 22 | 6.81 | 61 |
| Mich, E | 40 | 6.15 | 62 |
| Ohio, S | 35 | 5.79 | 63 |
| Kansas | 17 | 5.79 | 63 |
| Cal, S | 20 | 5.77 | 65 |
| Wisc, W | 13 | 5.29 | 66 |
| Texas, S | 52 | 5.17 | 67 |
| Virg, E | 32 | 4.96 | 68 |
| Wisc, E | 17 | 4.94 | 69 |
| N. J. | 45 | 4.86 | 70 |
| Ill, N | 41 | 4.41 | 71 |
| Ark, W | 6 | 4.31 | 72 |
| Oregon | 18 | 4.24 | 73 |
| Minnesota | 23 | 4.03 | 74 |
| Fla, M | 43 | 3.46 | 75 |
| Colorado | 20 | 3.44 | 76 |
| Penn, E | 20 | 3.33 | 77 |
| N. Y., N | 11 | 3.22 | 78 |
| Idaho | 6 | 3.16 | 79 |
| N. Y., S | 16 | 3.07 | 80 |
| New Hamp | 4 | 2.88 | 81 |
| Okla, E | 2 | 2.73 | 82 |
| Cal, C | 40 | 2.08 | 83 |
| Cal, E | 15 | 1.80 | 84 |
| N. Y., E | 14 | 1.67 | 85 |
| Mass | 10 | 1.43 | 86 |
| Cal, N | 10 | 1.22 | 87 |
| R. I. | 1 | 0.91 | 88 |
| Wash, W | 3 | 0.50 | 89 |
| Hawaii | 0 | 0 | 90 |