Nearly 500,000 Immigrants Go Through ICE’s Alternatives to Detention System in Two Years
Published Oct 20, 2022
According to new data obtained by TRAC through Freedom of Information Act (FOIA) requests, 480,301 people have been enrolled in ICE’s electronic monitoring program known as Alternatives to Detention (ATD) between August 2020 and June 2022. Many of these individuals, about 196,000, were previously active in ATD but have since ceased to be monitored under ATD, while 284,000 immigrants were still in ATD as of the end of June.
TRAC recently announced that the current total ATD population stands at over 316,000 and TRAC recently analyzed the growth of ATD during the first year of the Biden administration by looking at nationality, gender, and technology type. Missing from these data, however, was an understanding of the total number of immigrants included in ATD over time, as well as the inflow and outflow each month, since the total amount of growth does not account for turnover within the program.
By looking at the total number of people added to and removed from ATD, the public can have a better picture of the total number of people impacted by electronic monitoring. During the final months of the Trump administration, the number of people leaving ATD was larger than the number entering ATD, leading to a slight overall decline in the fall of 2020. Starting in February 2021, however, the number of people entering and leaving the program began to grow considerably.
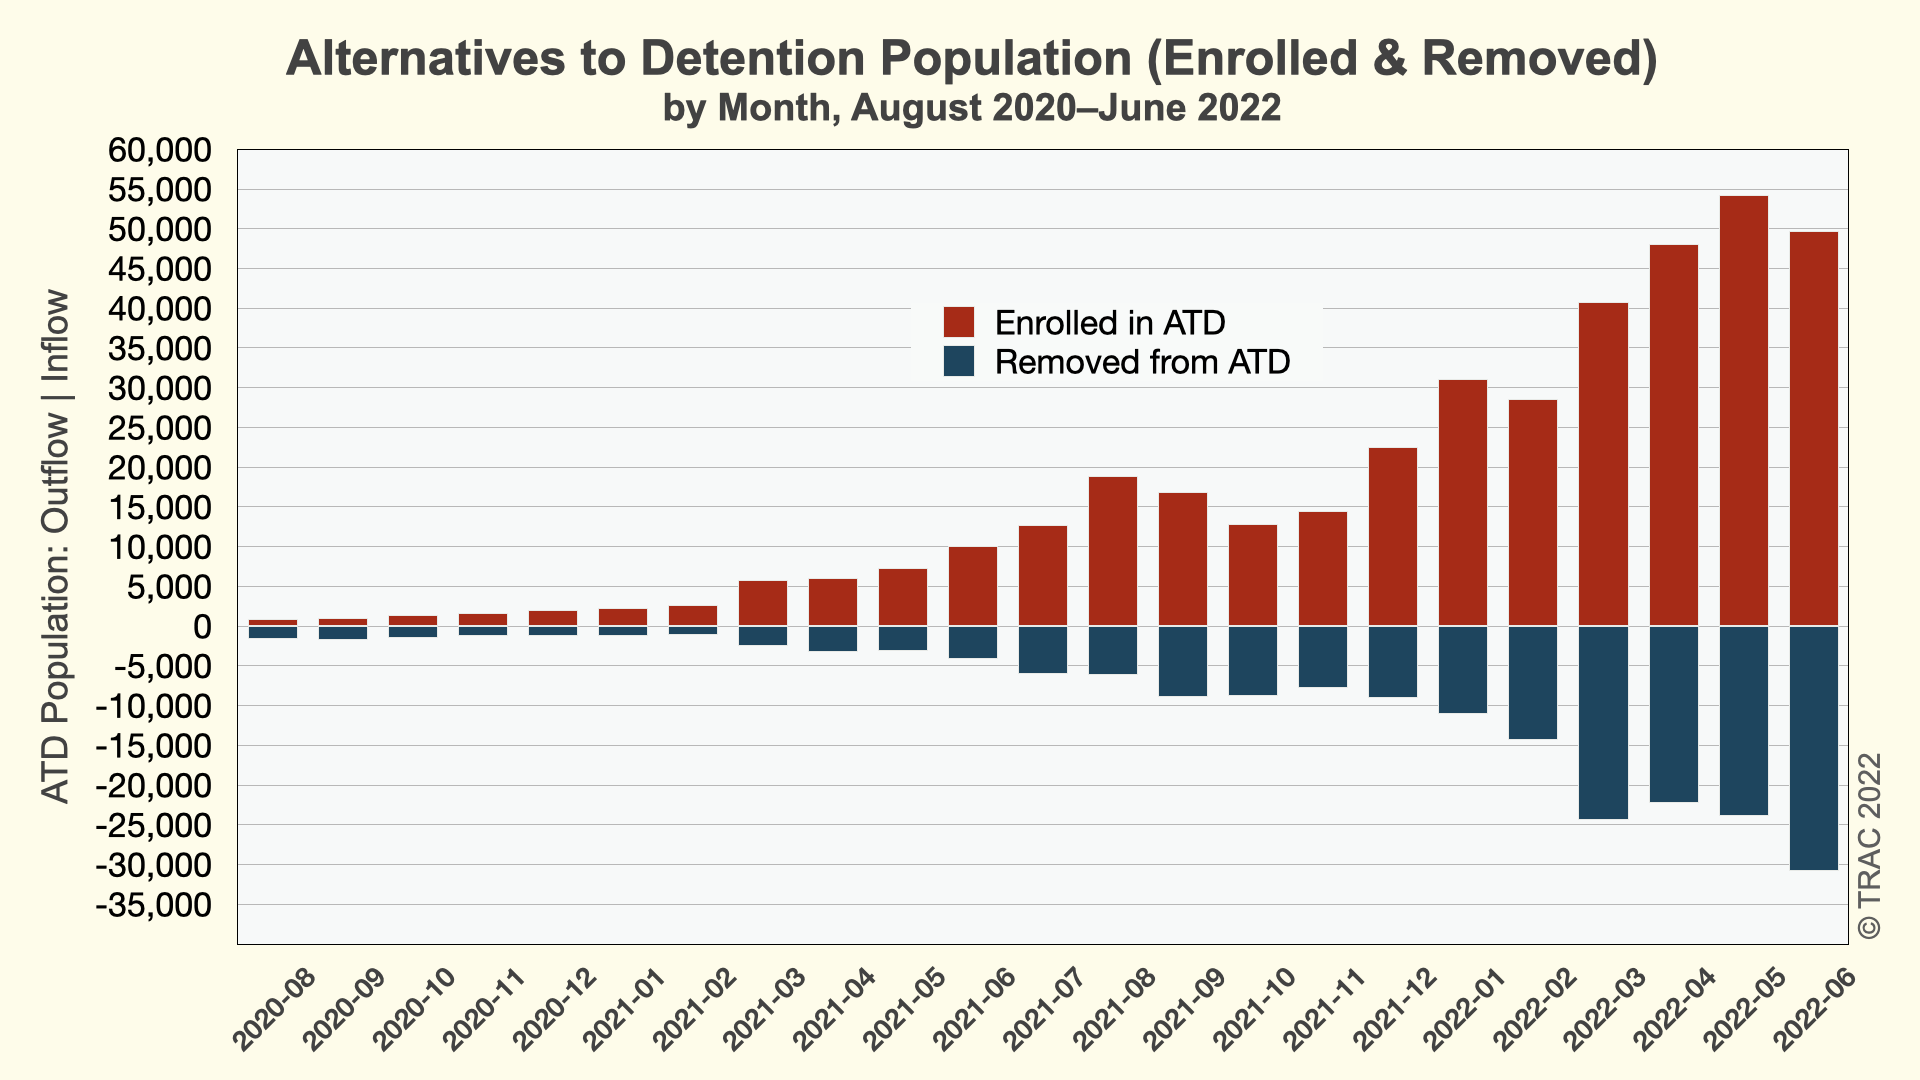
For instance, by the end of July 2021, the total ATD population reached 113,000, up nearly 7,000 from the end of June 2021. But this net increase of 6,718 is actually a result of ICE terminating 6,000 people from the program and enrolling 12,718 new people. The volume of turnover continued to increase in 2022. In May 2022, the largest number of new people—54,203 in a single month—were added to ATD even as 23,877 people were removed from monitoring under the program.
Immigrants have spent shorter and shorter time on ATD—about 200 days on average in 2022 down from 700 days on average at the start of the Biden administration. The rapid growth of ATD would likely have been even greater had ICE not also removed so many people from ATD monitoring. There are many reasons why people may be removed or terminated from ATD, including if they obtain temporary or permanent legal status, if they leave the country or are deported, if they are detained, or if ICE decides that ATD is no longer appropriate for the individual or family.[1] See Table 1.
| Month Year | Removed from ATD | Enrolled in ATD | Net Gain/Loss | Total ATD Population | Average Days on ATD for People Removed This Month |
|---|---|---|---|---|---|
| August 2020 | 1,583 | 855 | -728 | 87,356 | 567 |
| September 2020 | 1,719 | 998 | -721 | 86,635 | 589 |
| October 2020 | 1,530 | 1,402 | -128 | 86,507 | 635 |
| November 2020 | 1,262 | 1,700 | 438 | 86,945 | 620 |
| December 2020 | 1,299 | 2,090 | 791 | 87,736 | 617 |
| January 2021 | 1,252 | 2,226 | 974 | 88,710 | 700 |
| February 2021 | 1,131 | 2,672 | 1,541 | 90,251 | 674 |
| March 2021 | 2,469 | 5,840 | 3,371 | 93,622 | 636 |
| April 2021 | 3,290 | 6,068 | 2,778 | 96,400 | 694 |
| May 2021 | 3,190 | 7,285 | 4,095 | 100,495 | 741 |
| June 2021 | 4,138 | 10,059 | 5,921 | 106,416 | 630 |
| July 2021 | 6,000 | 12,718 | 6,718 | 113,134 | 480 |
| August 2021 | 6,157 | 18,949 | 12,792 | 125,926 | 532 |
| September 2021 | 8,949 | 16,873 | 7,924 | 133,850 | 455 |
| October 2021 | 8,751 | 12,909 | 4,158 | 138,008 | 351 |
| November 2021 | 7,845 | 14,510 | 6,665 | 144,673 | 345 |
| December 2021 | 9,065 | 22,506 | 13,441 | 158,114 | 313 |
| January 2022 | 11,049 | 31,113 | 20,064 | 178,178 | 243 |
| February 2022 | 14,321 | 28,573 | 14,252 | 192,430 | 184 |
| March 2022 | 24,414 | 40,811 | 16,397 | 208,827 | 180 |
| April 2022 | 22,197 | 48,088 | 25,891 | 234,718 | 206 |
| May 2022 | 23,877 | 54,203 | 30,326 | 265,044 | 209 |
| June 2022 | 30,793 | 49,769 | 18,976 | 284,020 | 182 |
TRAC previously reported that the growth in ATD between December 2020 and December 2021 was driven by large numbers of new Honduran, Venezuelan, Nicaraguan, Brazilian, and other nationalities entering the program, likely driven by conditions in sending countries and reflected in Border Patrol arrests at the US-Mexico border. These new data show how quickly these data can shift in a short period of time.
Between December 2021 and June 2022, the total ATD population nearly doubled from 158,000 to 284,000. The number of Guatemalans, Mexicans, and Hondurans—which made up a very large proportion of ICE’s ATD population at the start of the Biden administration, declined in relative and absolute numbers. In contrast, the number of Cubans, Nicaraguans, Venezuelans, Colombians, and Peruvians grew dramatically. People from Cuban now made up 22 percent of ICE’s total ATD numbers, Nicaraguans made up 16 percent, and Venezuelans made up another 10 percent. See Table 2.
| Nationality | December 2020* | December 2021* | June 2022 |
|---|---|---|---|
| Guatemala | 24,356 | 23,189 | 20,309 |
| Honduras | 14,771 | 22,693 | 20,632 |
| Mexico | 18,131 | 16,467 | 13,966 |
| Venezuela | 608 | 15,884 | 29,289 |
| Nicaragua | 833 | 14,846 | 45,245 |
| El Salvador | 12,191 | 13,567 | 12,452 |
| Brazil | 2,170 | 11,643 | 12,693 |
| Haiti | 2,677 | 9,029 | 9,725 |
| Cuba | 1,813 | 8,118 | 62,003 |
| Ecuador | 596 | 7,341 | 8,638 |
| Colombia | 204 | 2,365 | 19,489 |
| India | 1,522 | 1,852 | 4,765 |
| Peru | 233 | 1,115 | 7,840 |
| Turkey | 88 | 888 | 2,793 |
| Russia | 345 | 816 | 1,870 |
| Romania | 292 | 723 | 943 |
| China | 944 | 605 | 660 |
| Cameroon | 485 | 468 | 572 |
| Armenia | 322 | 417 | 403 |
| Ukraine | 172 | 270 | 554 |
| Uzbekistan | 110 | 259 | 593 |
| Dominican Republic | 112 | 242 | 604 |
| Ghana | 166 | 228 | 460 |
| Jamaica | 177 | 227 | 649 |
| Vietnam | 298 | 226 | 207 |
| All Other | 2,932 | 3,679 | 6,666 |
| Grand Total* | 86,548 | 157,157 | 284,020 |
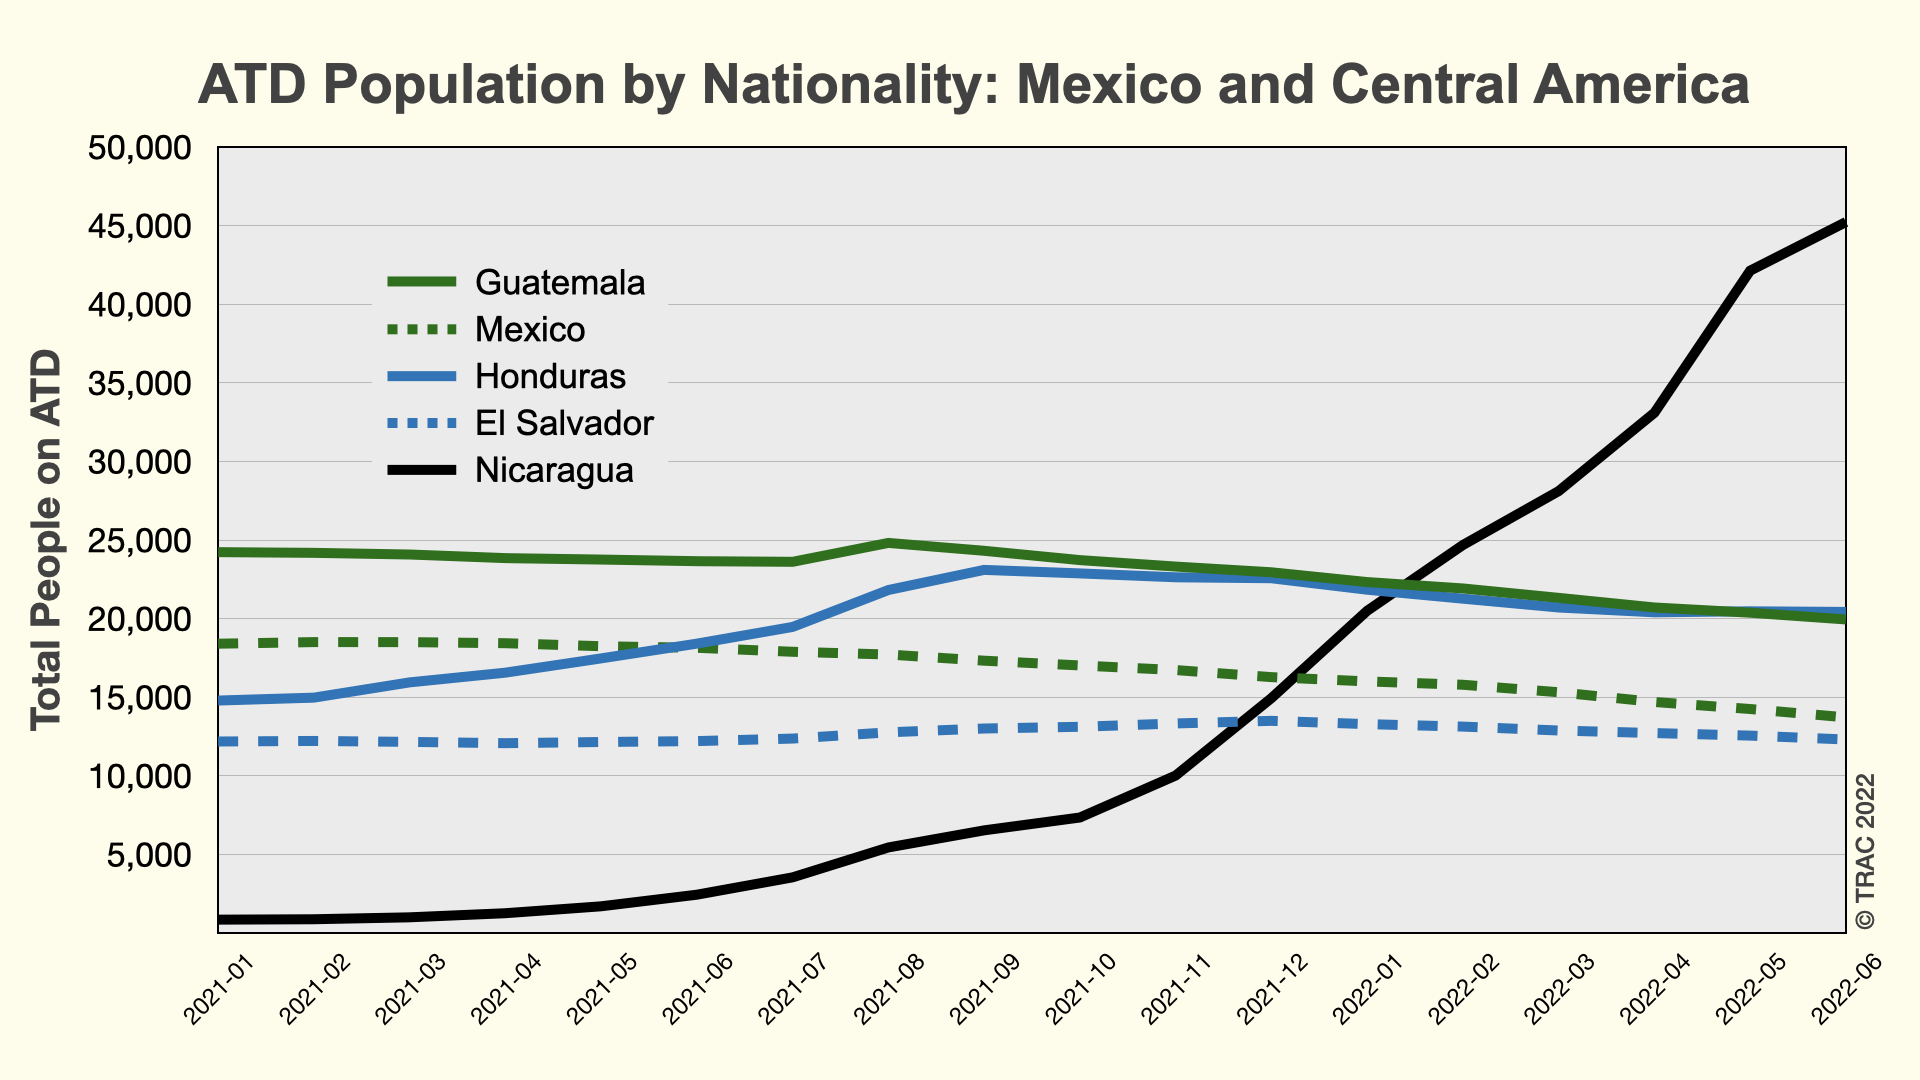
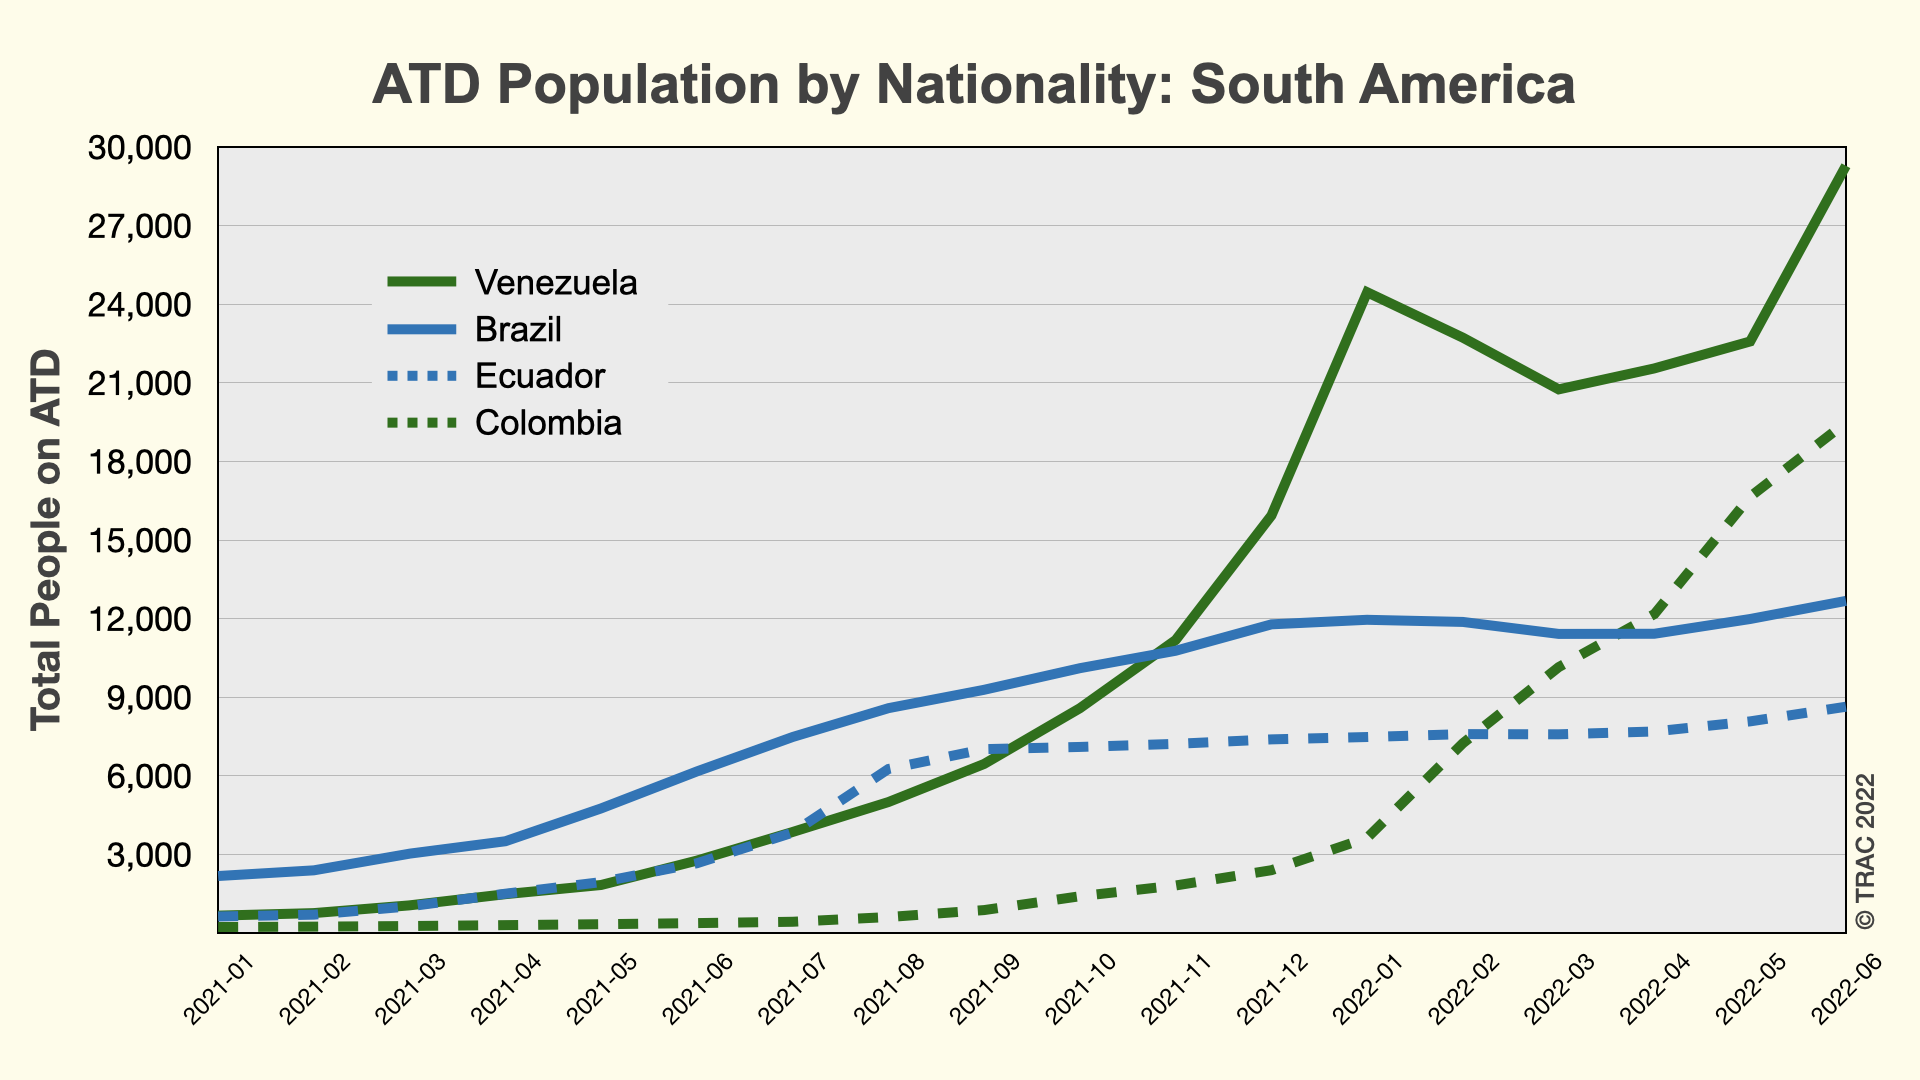
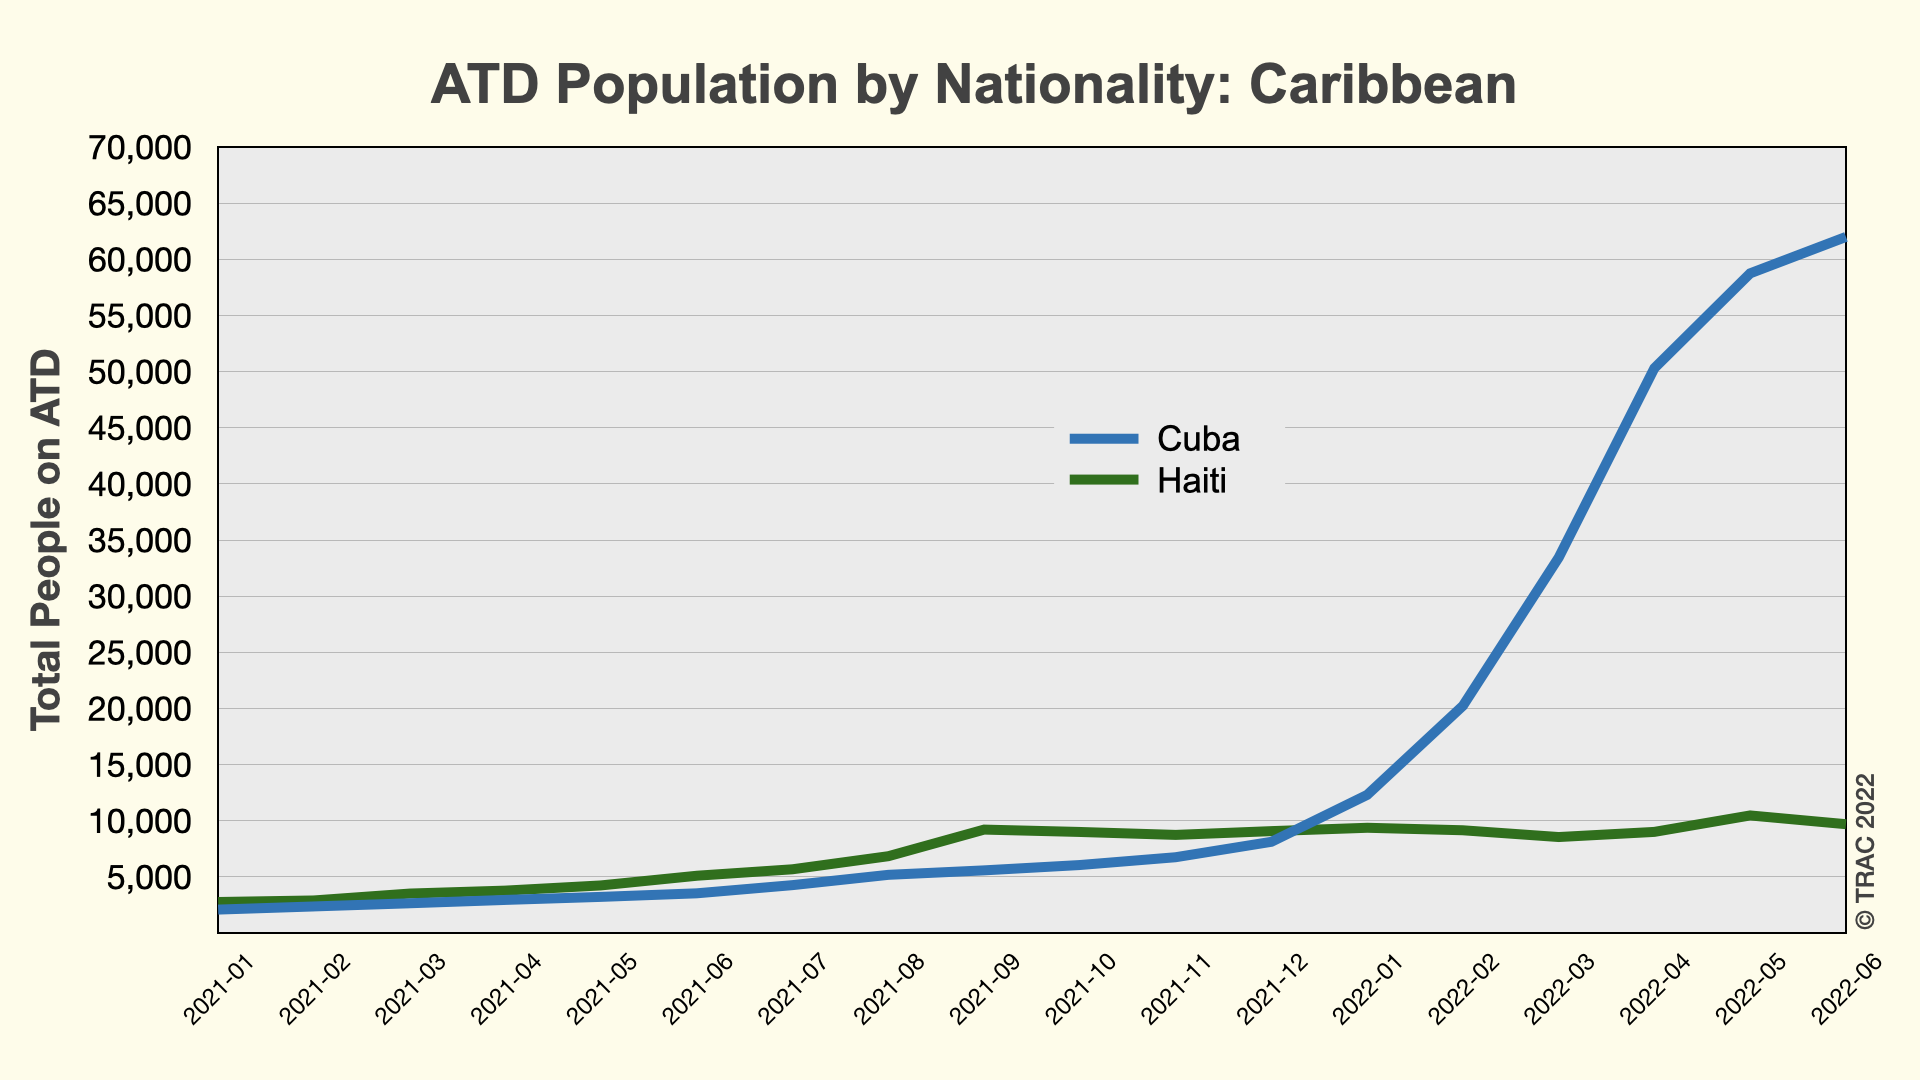
As the following three graphs show, there are considerable differences between nationalities on ATD even from the same regions, again likely influenced by border policies such as Title 42, although other factors may contribute to who ICE and Customs and Border Protection (CBP) decides to monitor.
Among immigrants from Mexico and Central America, only Nicaraguans have seen recent growth. The number of Venezuelans and Colombians in ATD continues to grow, while the number of Brazilians and Ecuadorians leveled off in 2022. Cubans, many of whom have been allowed into the United States recently, are now on electronic monitoring, while Haitians, many of whom have been turned away or deported, on the other hand, do not constitute a particularly large group.