A Close Look at the Geography of Border Patrol Arrests: How a Spike in Annual Arrests Along U.S.-Mexico Border Hides Remarkable Variation by Sector and Nationality
Published Aug 15, 2023
The Southwest Border is often represented as a single, uniform line separating the United States and Mexico. But at nearly 2,000 miles, touching four U.S. states and six Mexican states, and crossing multiple terrains and ecosystems, this representation of the border can obscure the geographically-specific trends in the number and nationality of migrants arrested by Border Patrol in each of the agency’s nine sectors.
This report examines nearly fifteen years of data on Border Patrol arrests to emphasize two significant trends that shape how the public understands the border and border enforcement. First, whereas the San Diego and Tucson sectors fifteen years ago were the busiest sectors for Border Patrol arrests, these two sectors have been largely supplanted by sectors in Texas as well as the relatively narrow Yuma sector in terms of percent of arrests—suggesting, in part, a significant shift in where migrants are crossing. Second, although the historical framework for immigration enforcement along the Southwest Border was geared towards Mexican nationals, the past decade has seen considerable diversification of who Border Patrol is encountering, beginning with Central American migrants and expanding recently to even more nationalities throughout Latin America, the Caribbean, and beyond.
Due to CBP’s delays in processing TRAC’s FOIA requests for records, the data in this report are complete through the end of July 2022. However, the historical trends presented in this report provide a data-driven perspective that reinforces on-the-ground reporting and lays the groundwork for further analysis when CBP eventually responds with updated records.
Border Patrol Sectors
Border Patrol is responsible for enforcing immigration laws between ports of entry, which includes identifying, arresting, and processing people that cross into the country unlawfully, including those who are seeking asylum. Border Patrol is divided up into nine sectors along the U.S.-Mexico border: four in Texas (Laredo, Big Bend, Del Rio, and El Paso), two in Arizona (Tucson and Yuma), and two in California (El Centro and San Diego)[1]. The map in Figure 1 shows these nine sectors along the border.
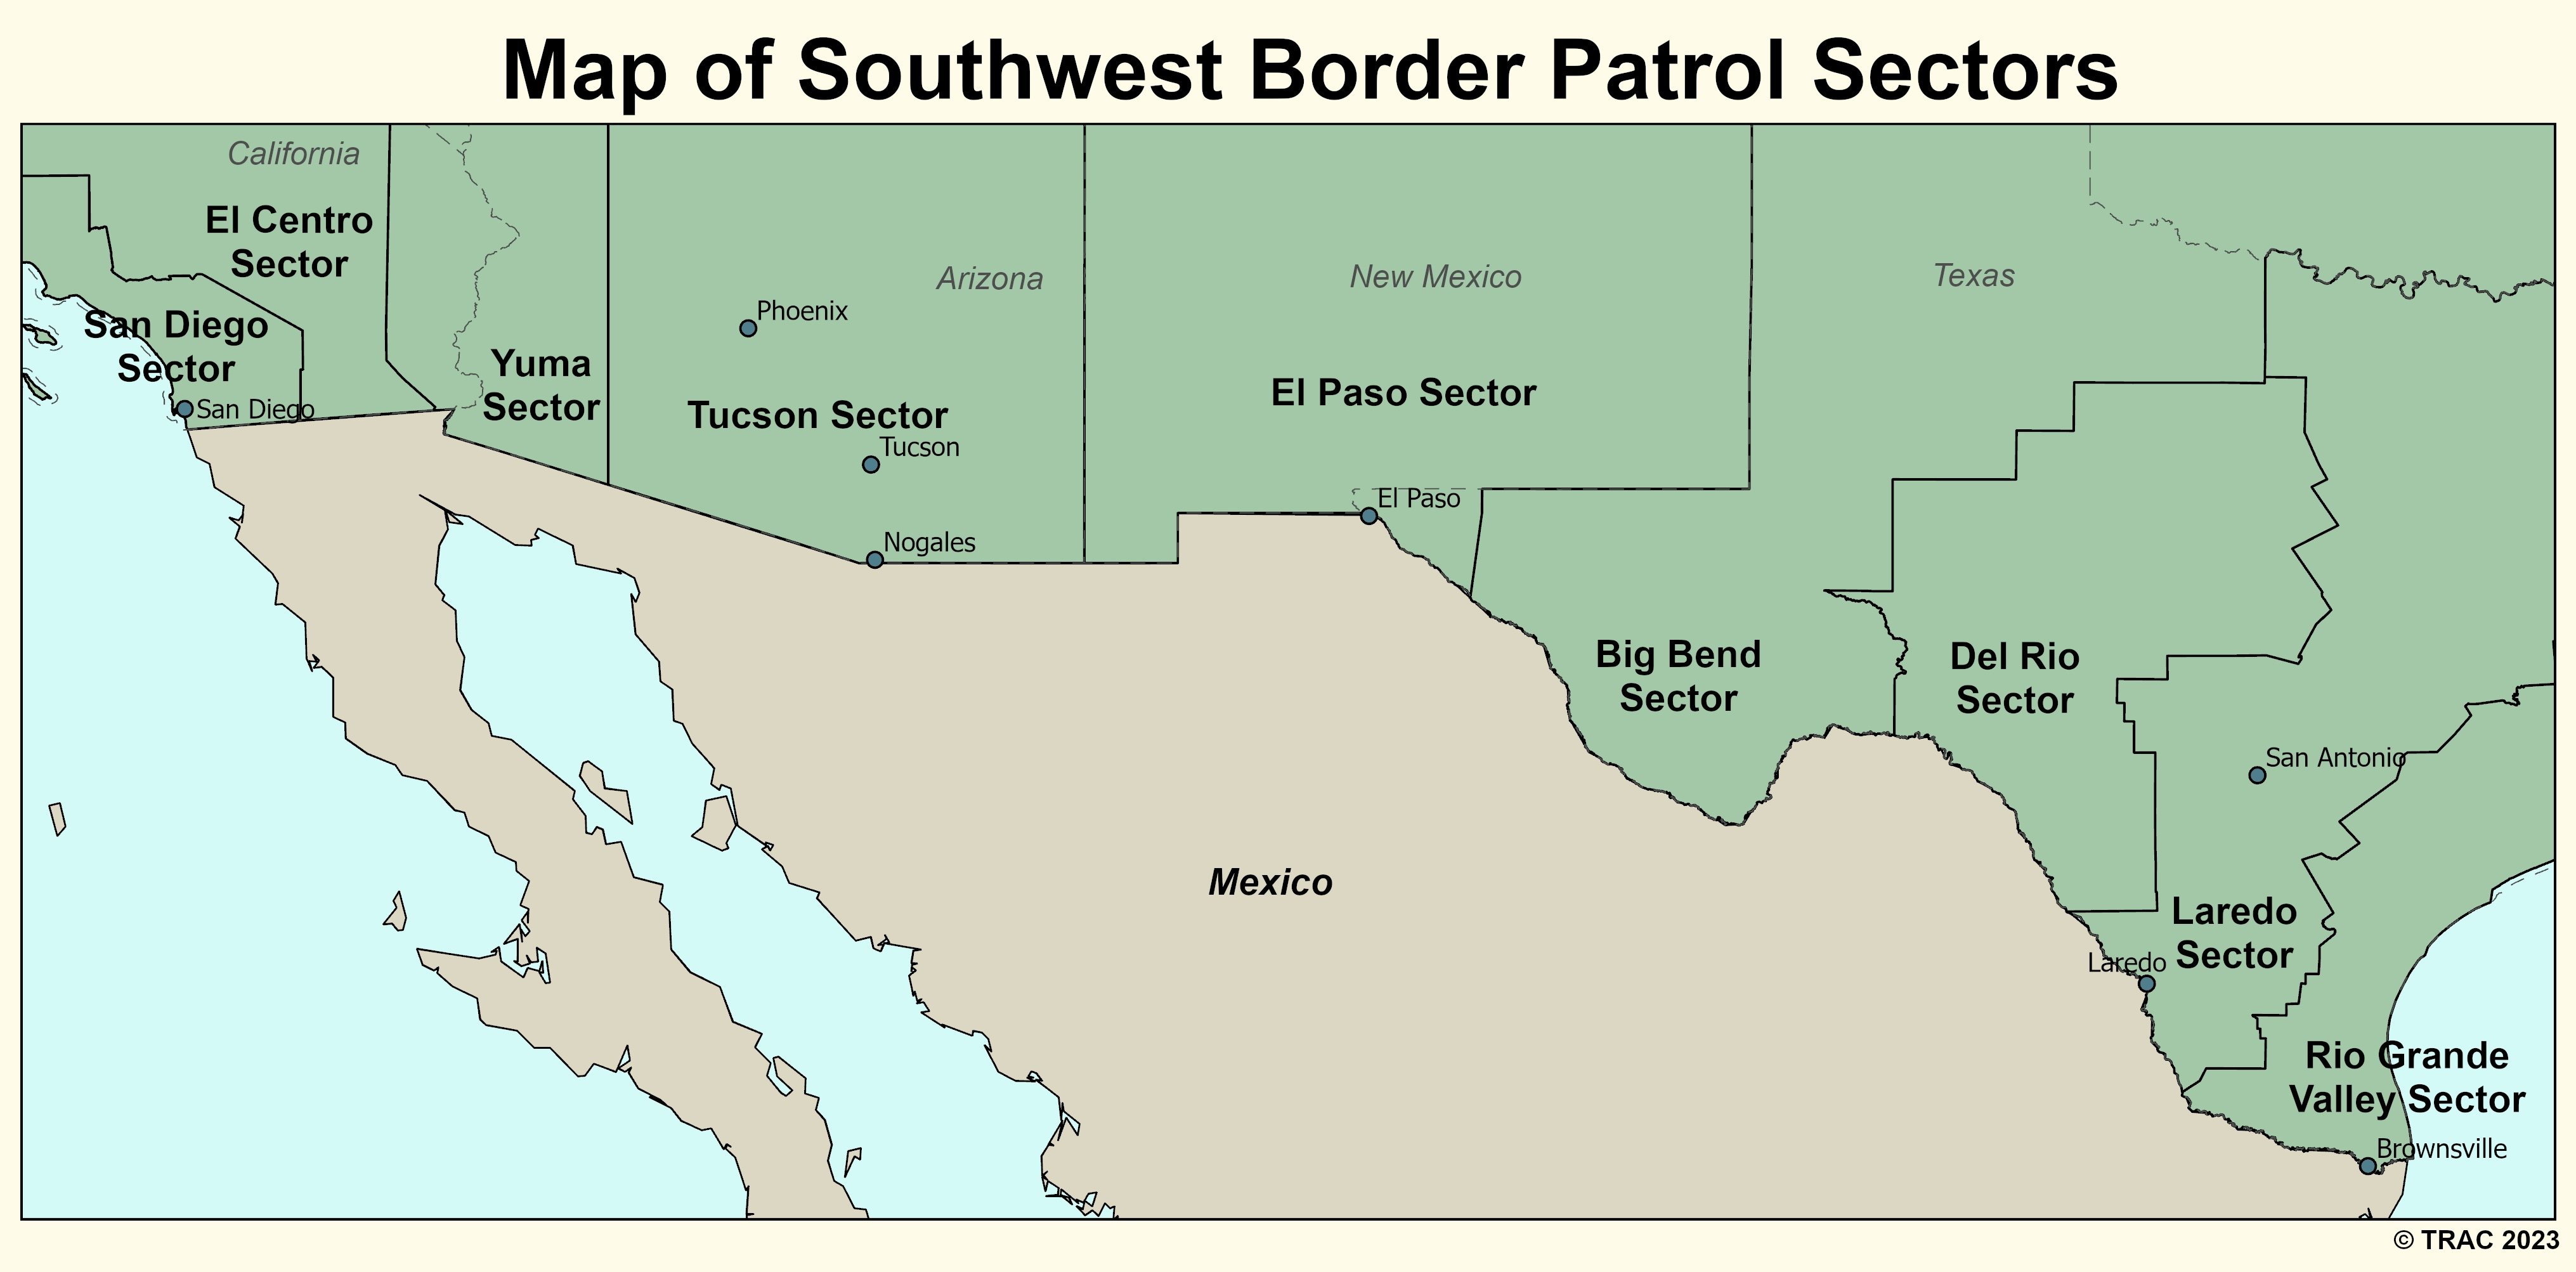
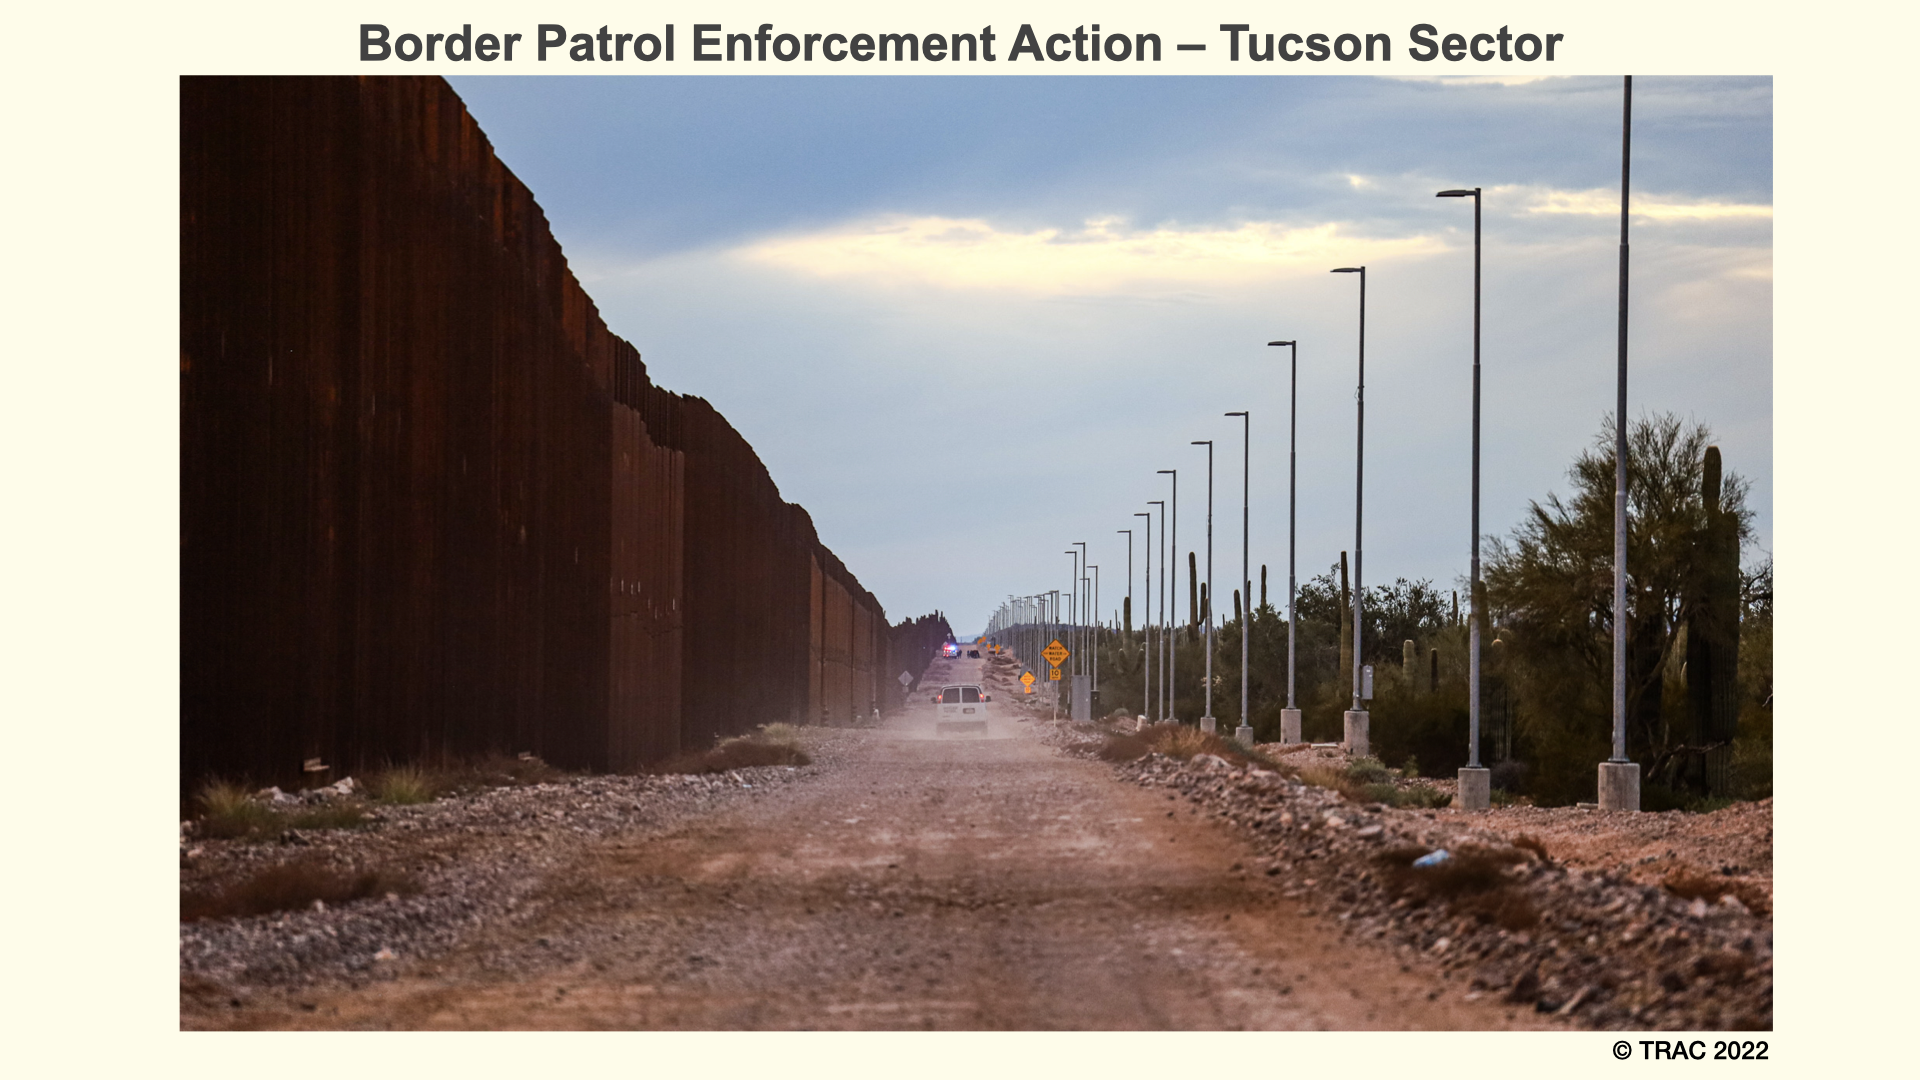
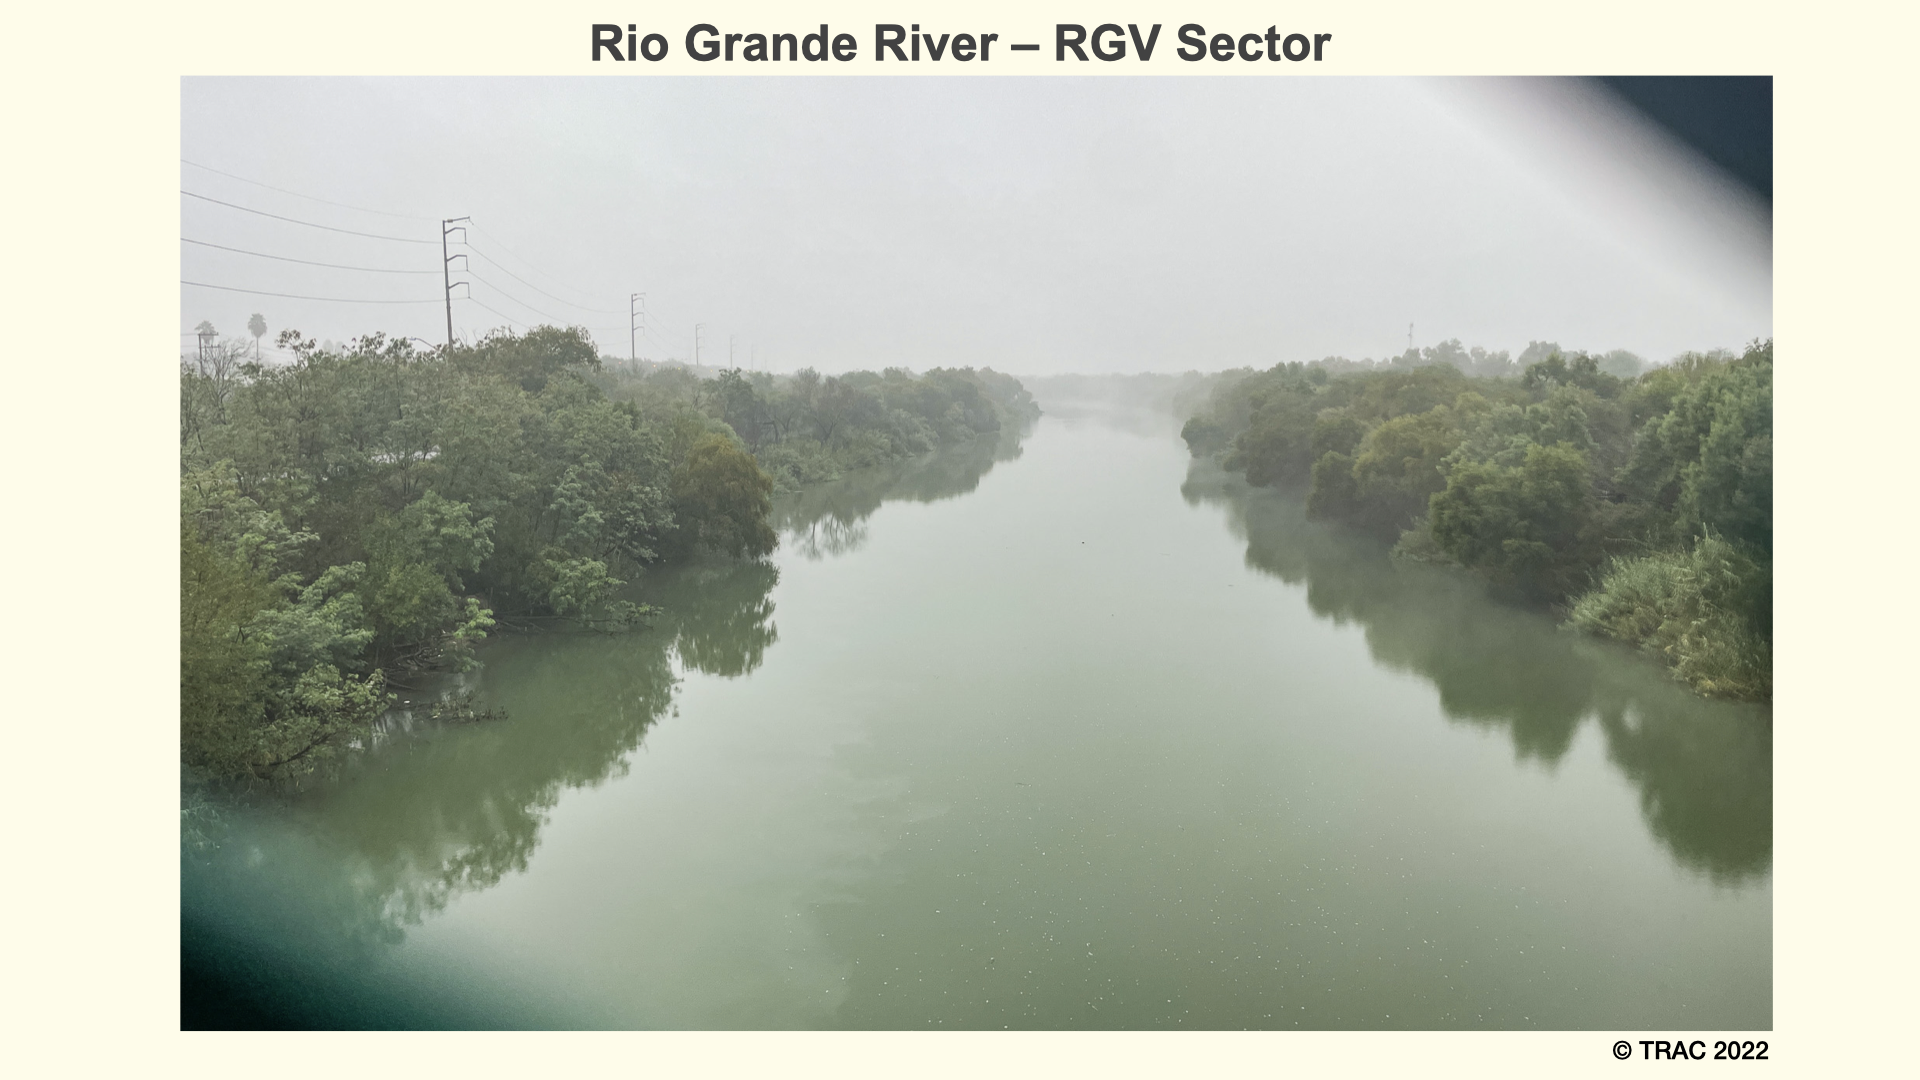
The landscape of these nine sectors also vary widely, with some sections of the border in southern Arizona running through rugged desert terrain (as in Figure 2) and other sections of the border in South Texas run through lush vegetation along the Rio Grande River (as in Figure 3).
Geographic Shift in Border Patrol Arrests by Sector
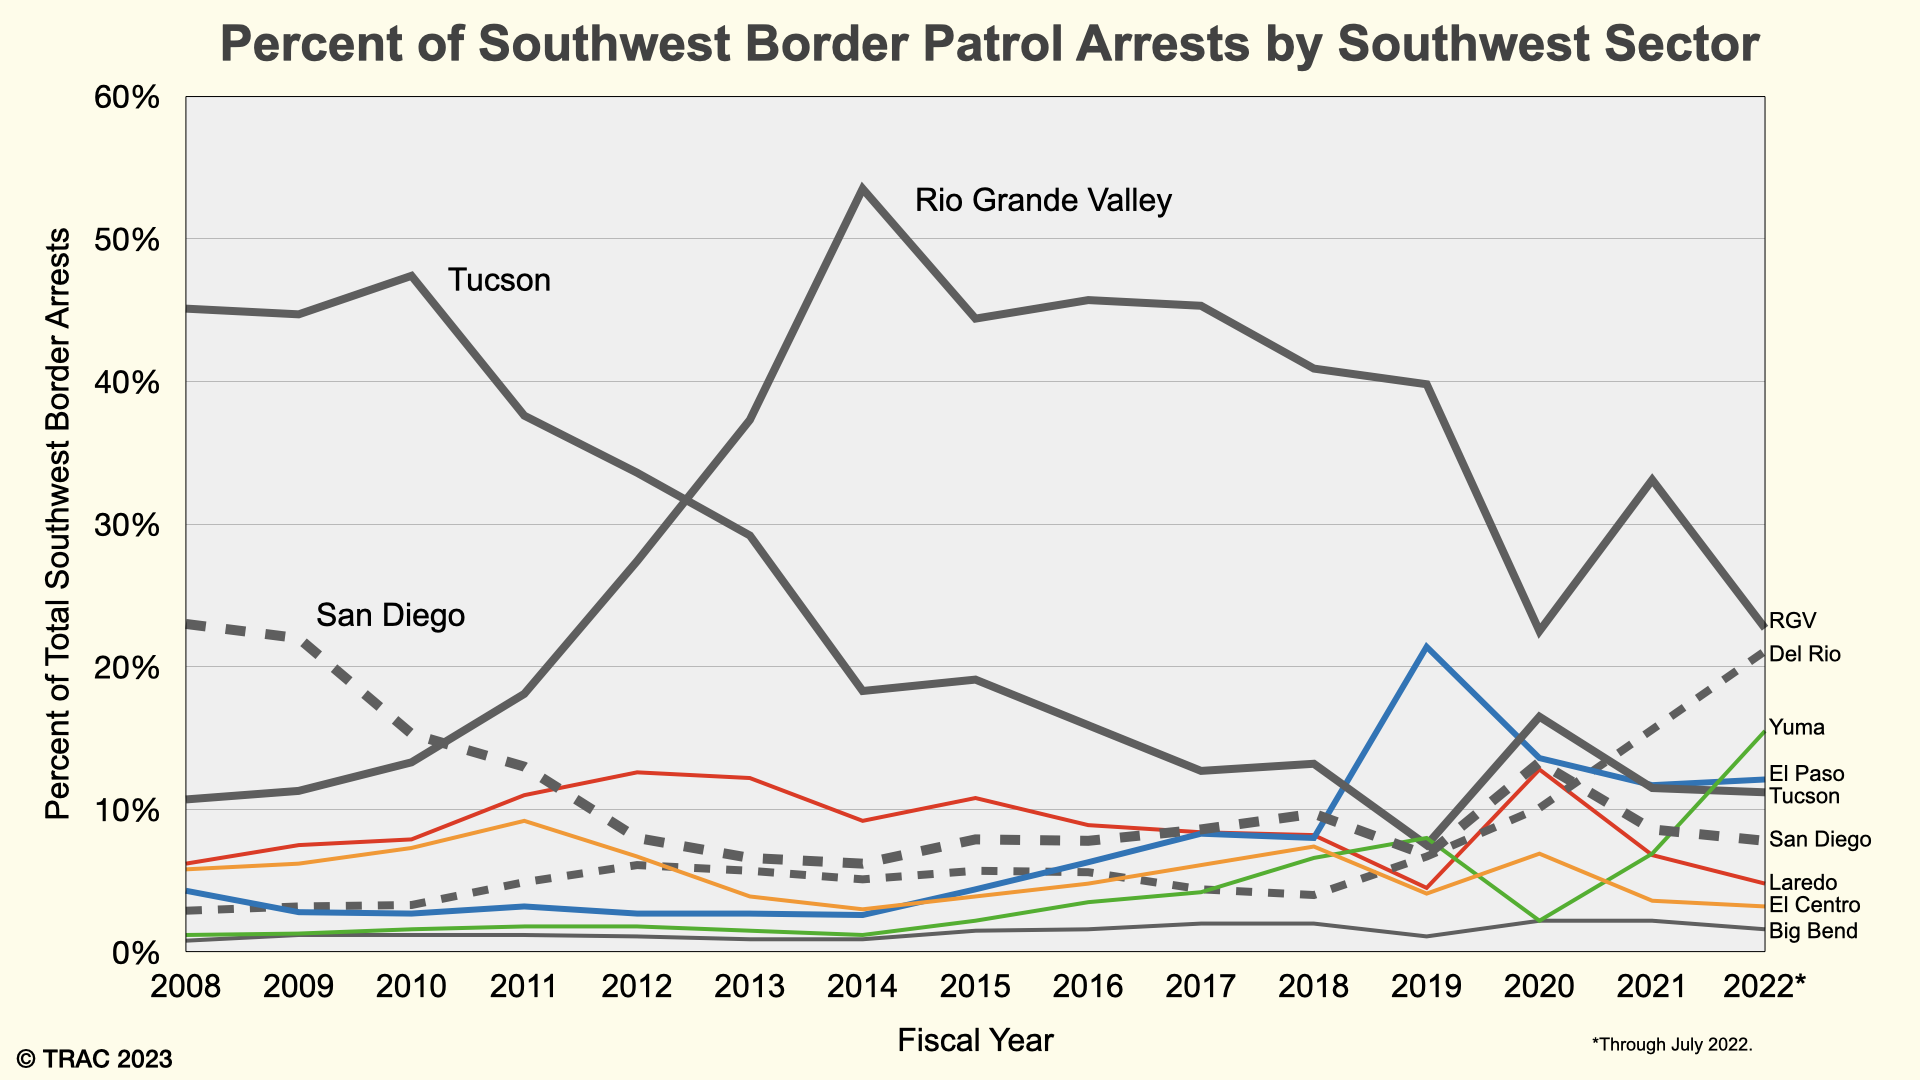
Border enforcement has undergone many changes over the last three decades.[2] The Tucson and San Diego sectors used to see more arrests than any other southwest sectors. For example, between 2008 and 2012, the Tucson sector was the busiest sector for arrests, making up as much as 45 percent of the total arrests along the border.[3] In 2008 and 2009, the San Diego sector made up another 15 to 23 percent—the second highest along the border in those years.
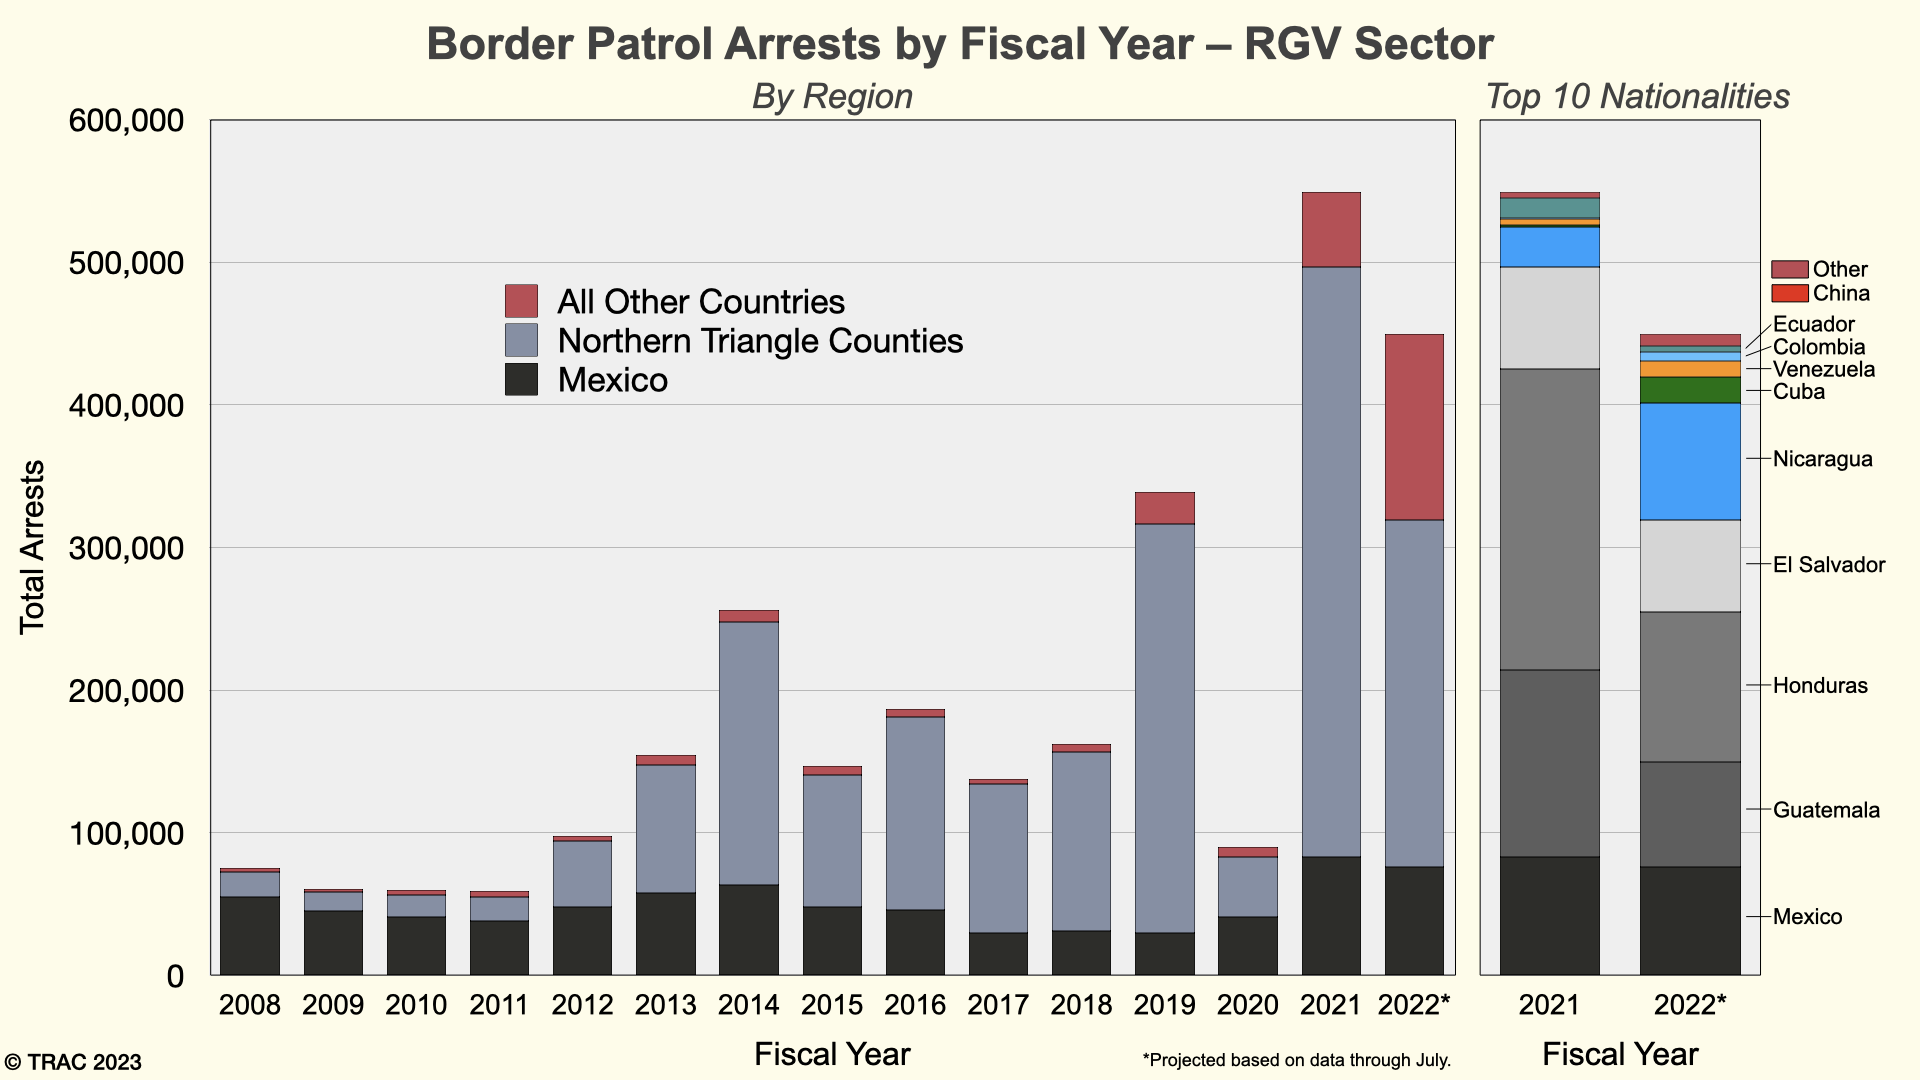
Since 2010, however, the percent of arrests in the Rio Grande Valley (RGV) sector increased dramatically and overtook both San Diego and Tucson to make up over half of all Border Patrol arrests along the Southwest border by 2014. Even with some decline in relative numbers of arrests, RGV remained the sector with the most arrests as of July 2022. Del Rio, also in southern Texas, and Yuma, the narrowest sector, have also raced to second and third place with 21.1 percent and 15.5 percent of total southwest arrests respectively. These trends are visible in Figure 4, which shows the percent of Border Patrol arrests along the Southwest Border by sector each fiscal year.
Diversification of Nationality Along Southwest Border
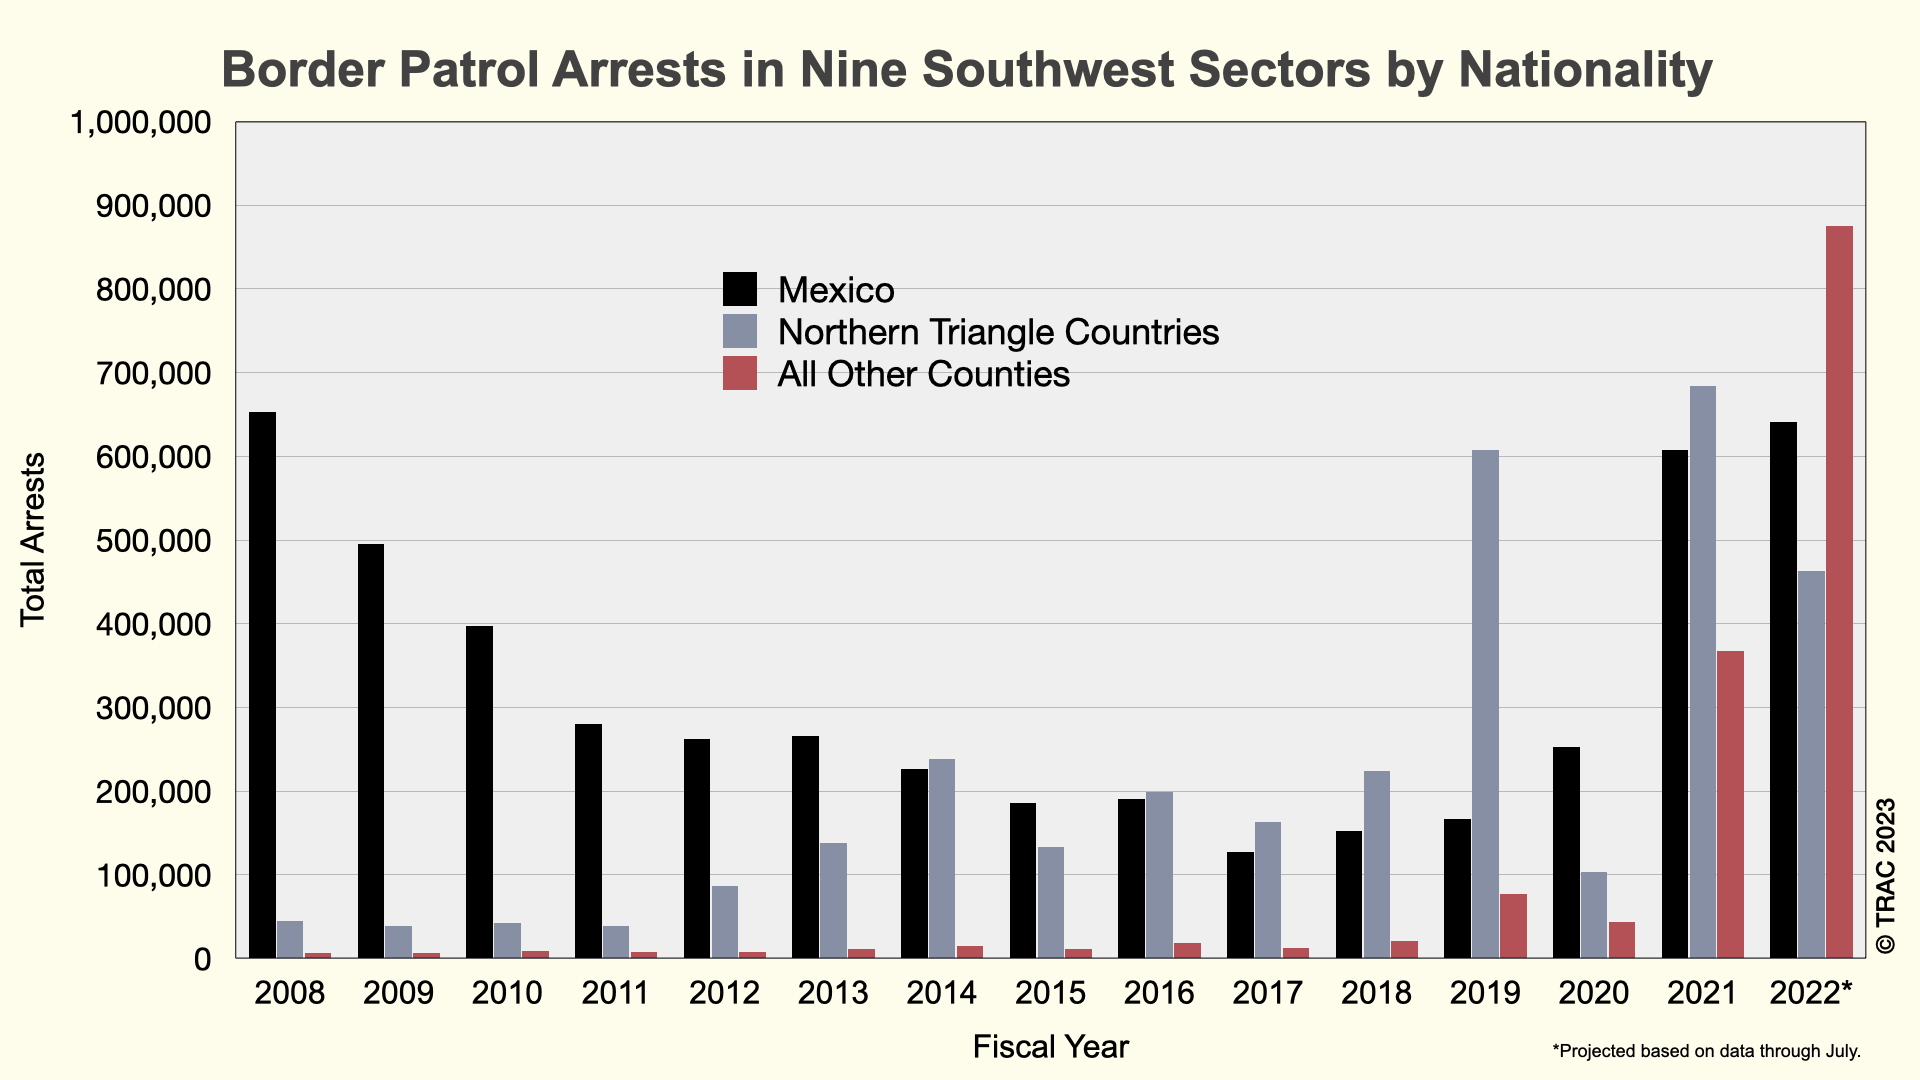
Alongside the shift in where the largest numbers of arrests take place, migrants arrested by Border Patrol show tremendous diversification over time. Mexicans, often single Mexican males, were historically the primary target for Border Patrol. As late as FY 2013, Mexican nationals made up the largest group of arrests. However, since 2012, migrants from Guatemala, Honduras, and El Salvador—three countries often referred to collectively as the Northern Triangle countries—increased steadily and overtook Mexican nationals as the group with the most arrests. This trend continued, with some reversal in FY 2020 and again in FY 2022. In fact, it is notable that throughout the Obama administration the number of arrests of Mexican nationals in particular declined steadily until the start of the Trump administration, and has now increased during the Biden administration to numbers not seen since FY 2008.
What is even more remarkable than the recent overall increase in Border Patrol arrests is the number of arrests of migrants who were from beyond Mexico or the Northern Triangle countries. Fiscal year 2021 saw a dramatic increase in the number of these migrants, which grew from just 7,777 in FY 2011 to over a third of a million arrests (367,275) in FY 2021. These numbers increased again to 728,742 arrests in FY 2022, marking the first year that non-Mexican and non-Northern Triangle nationalities outpaced the other two. This can be seen in Figure 5 below. The section below breaks these data out further by Border Patrol sector.
Although a variety of factors contribute to these numbers, Title 42, the public health policy implemented during the COVID-19 pandemic which allowed Border Patrol to turn migrants away at the border, is relevant for making sense of these numbers. Title 42 expulsions, as well as the broader enforcement posture of Border Patrol during Title 42, led to two important consequences. First, migrants (including asylum seekers) who attempted to cross typically found no access to asylum and faced no direct legal consequences. This combination may have contributed to an increase in repeated attempts. Second, while migrants were turned away (even multiple times), new migrants still arrived at the border contributing to a build-up in the number of people interested in crossing the border. These and other factors contributed to a considerable growth in the overall number of arrests along the Southwest border.
Wide Variations in Arrests by Nationality Along Nine Border Patrol Sectors
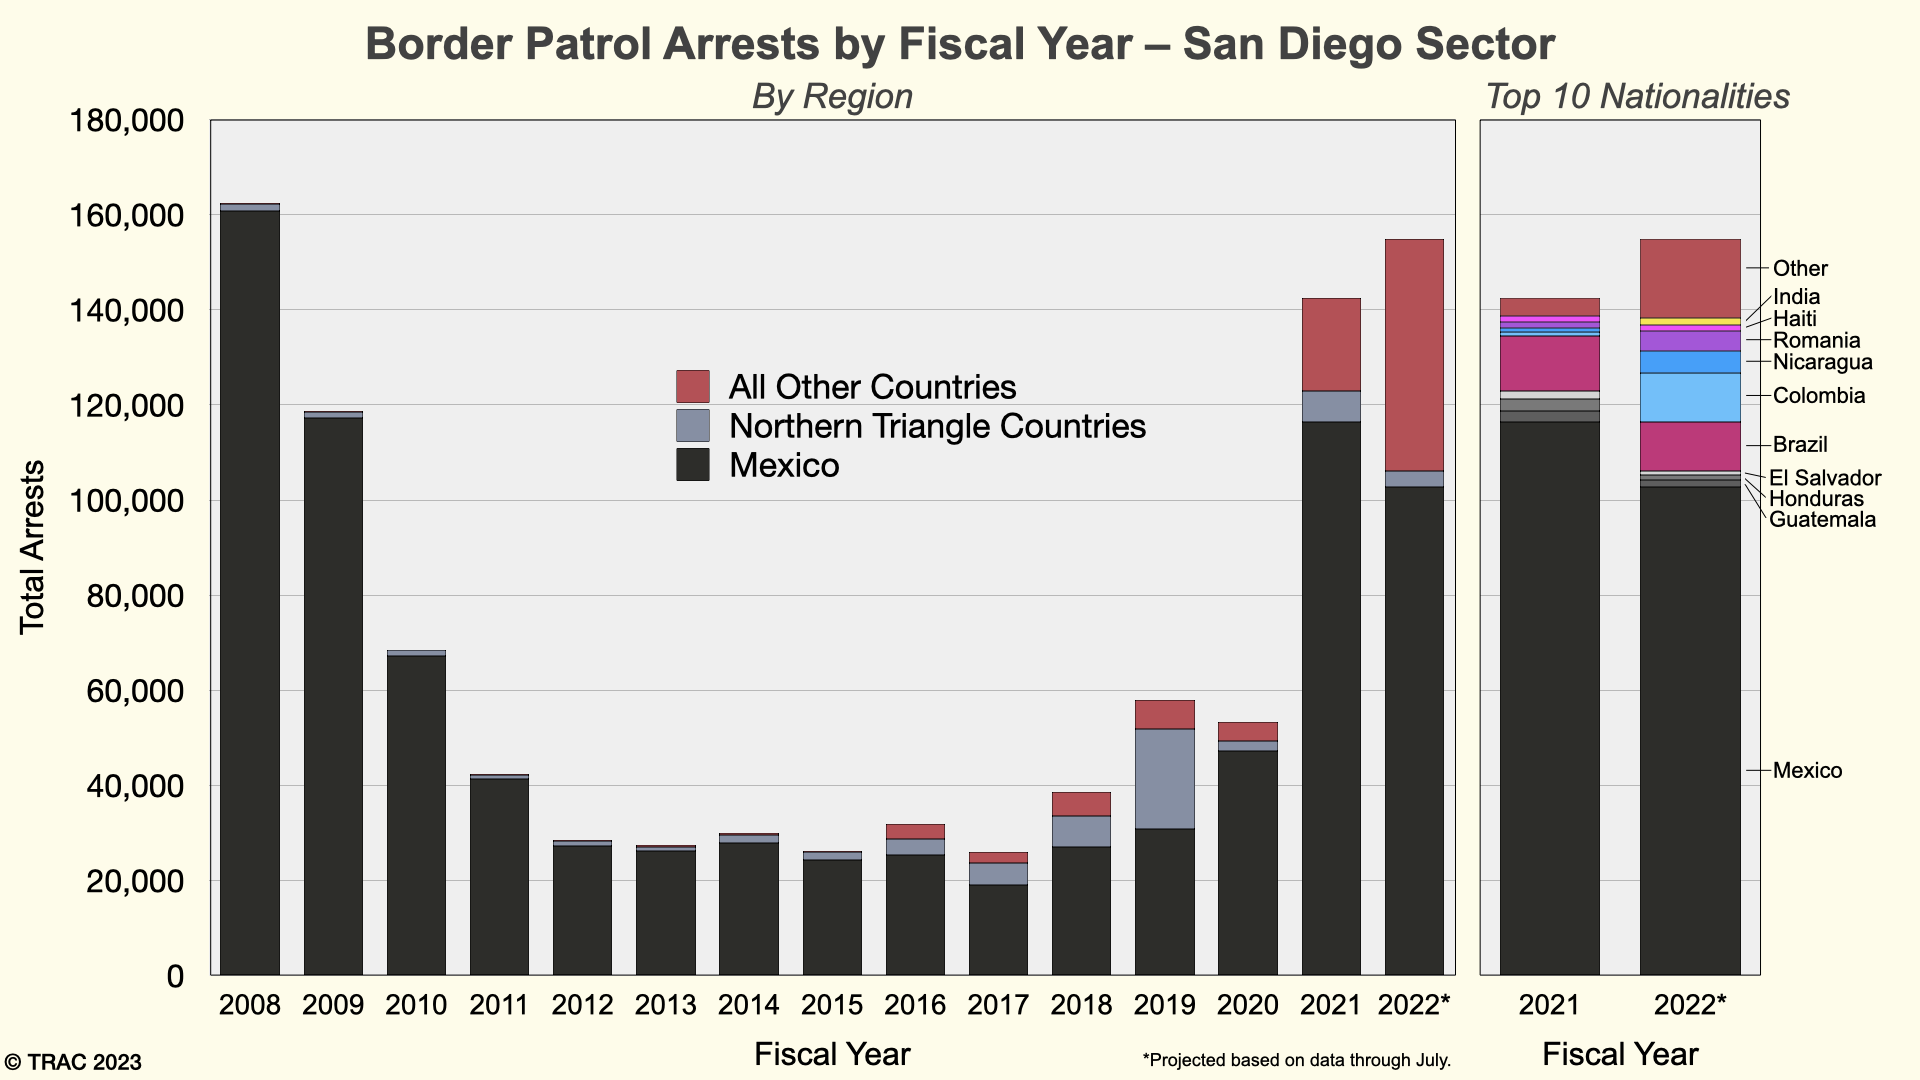
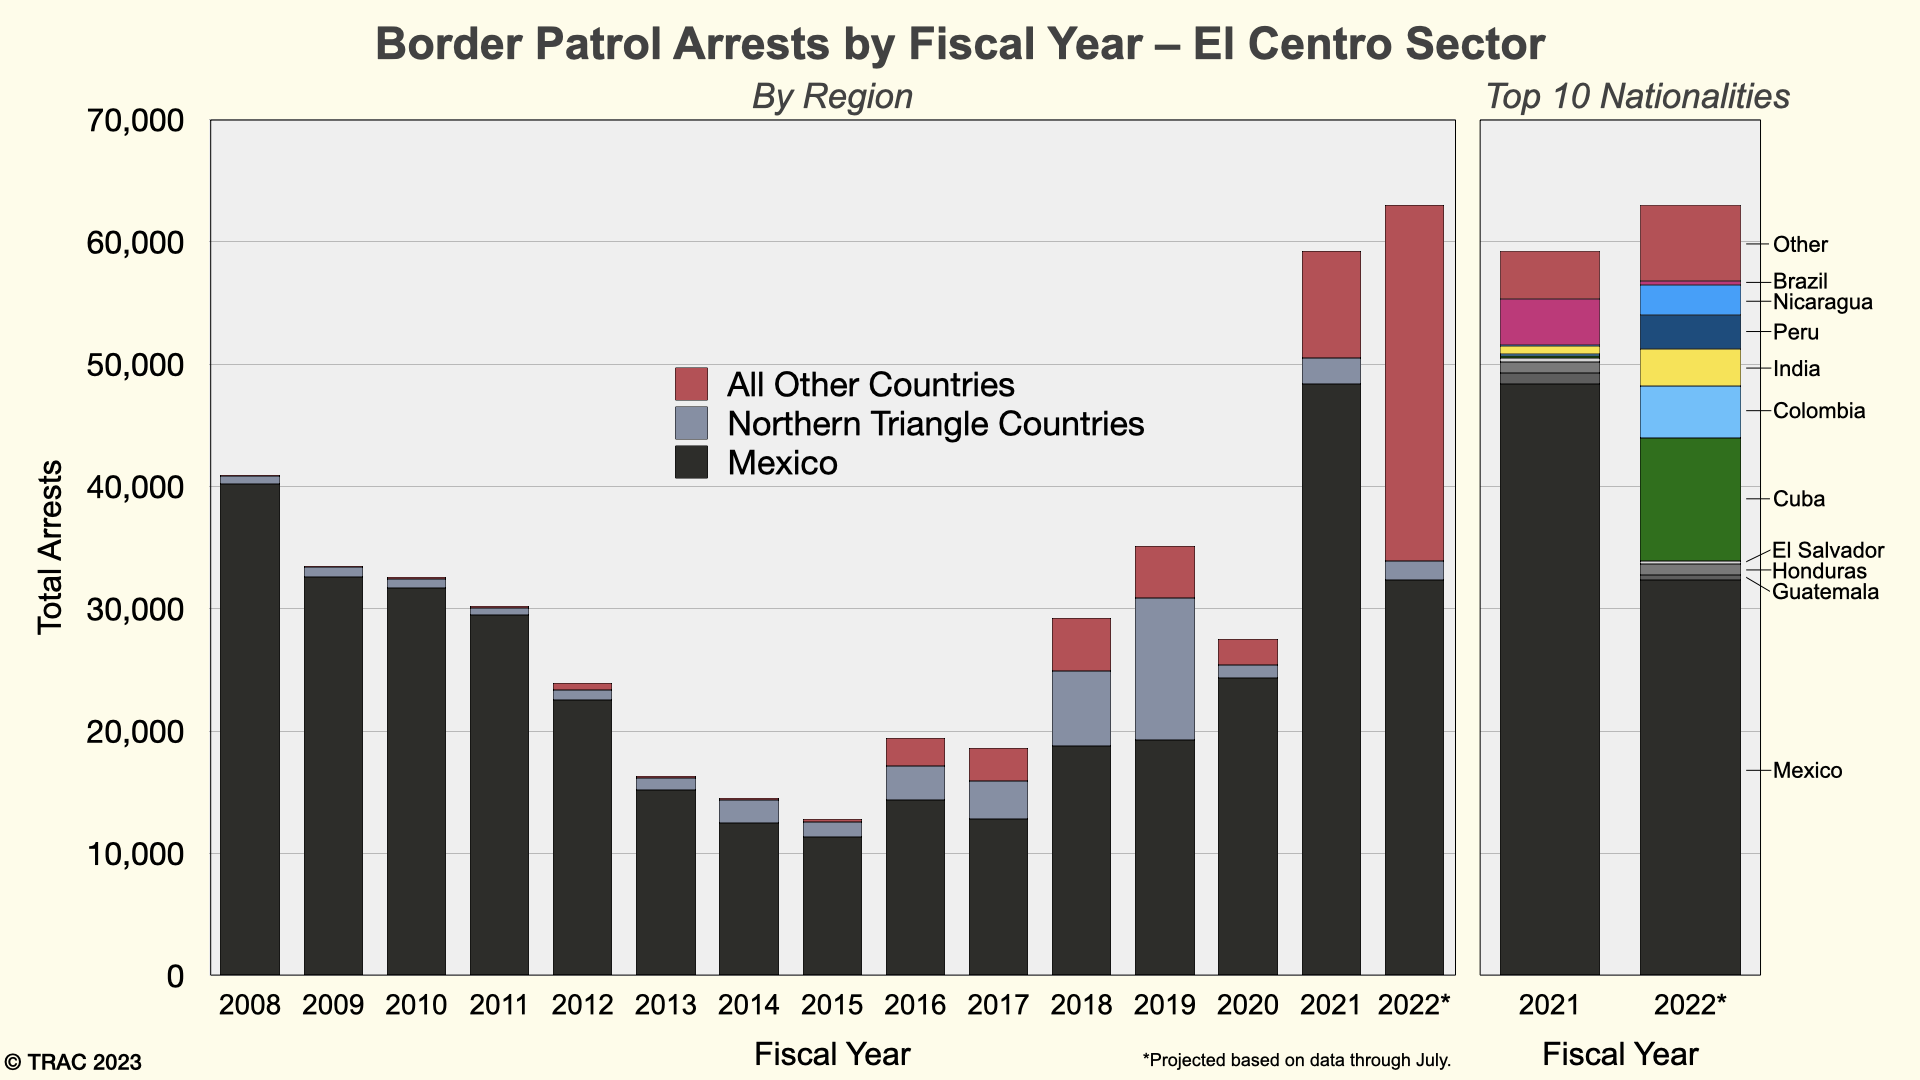
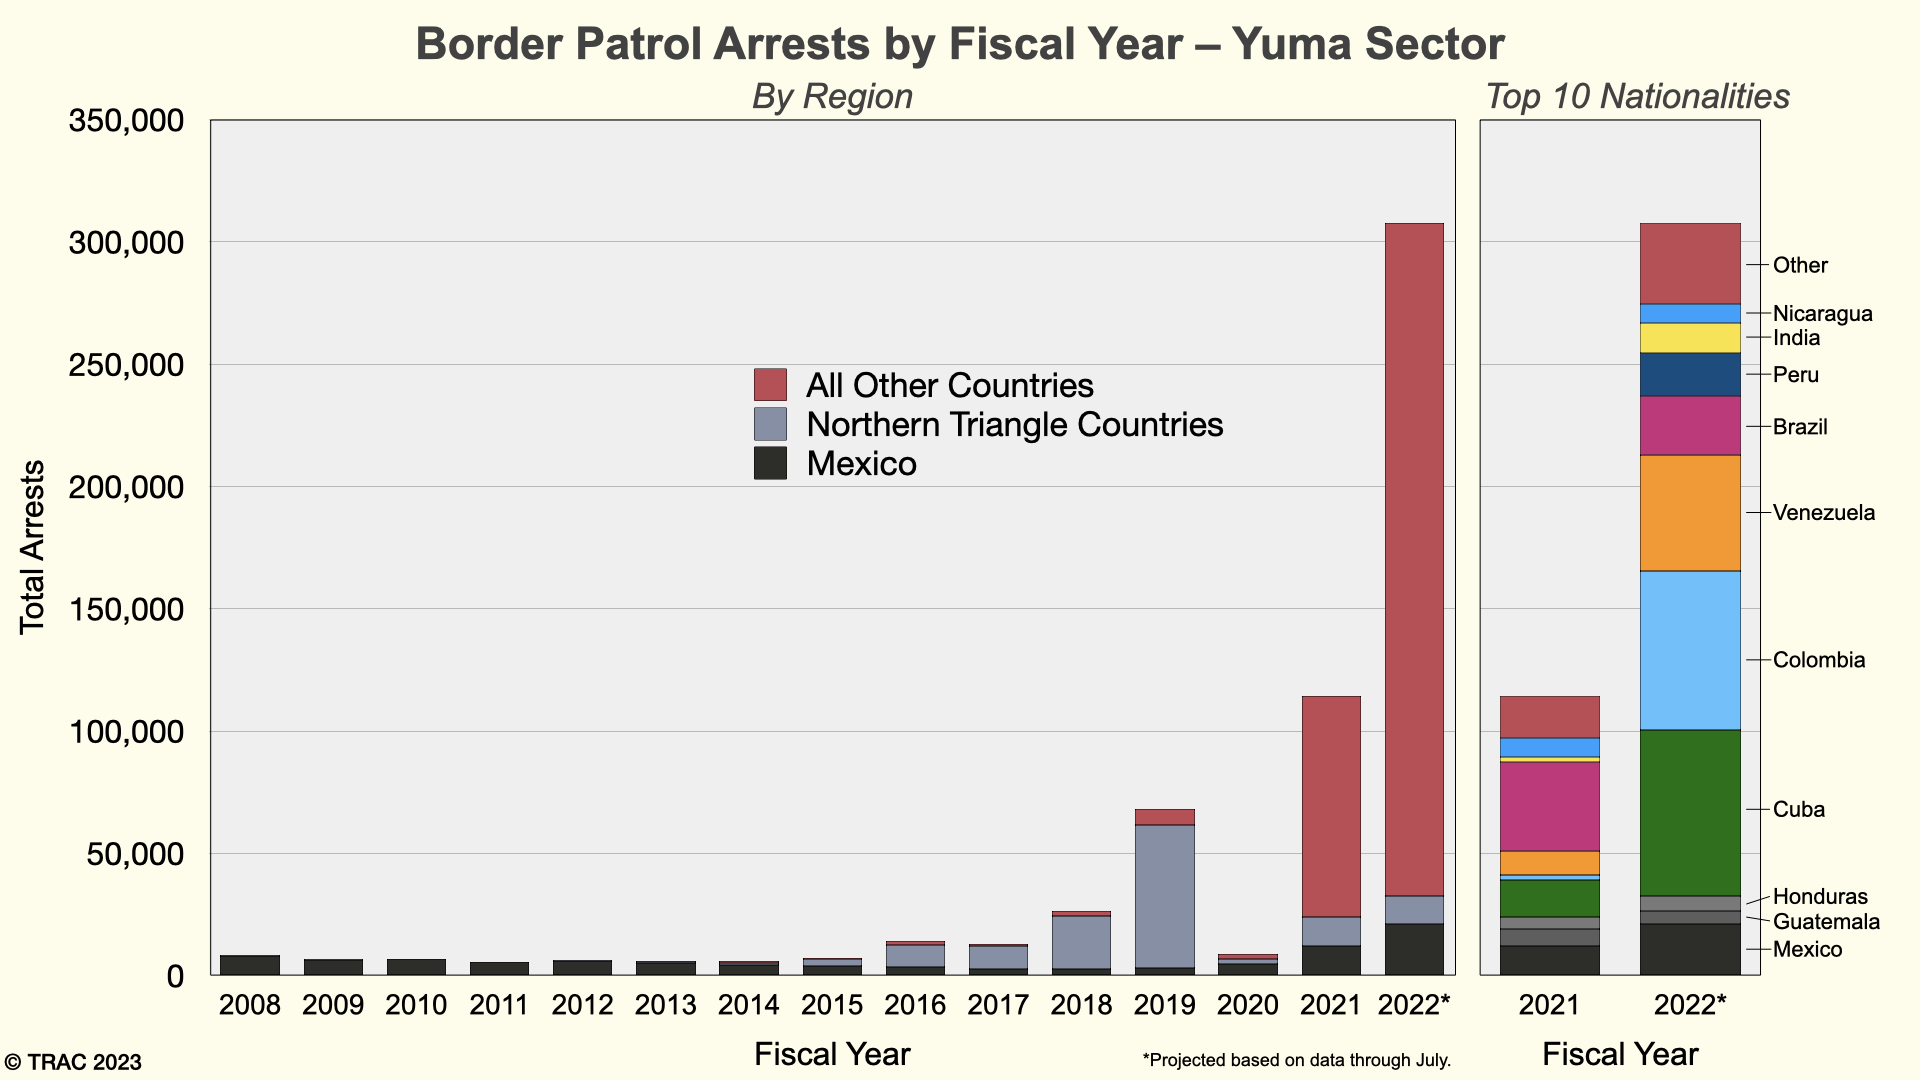
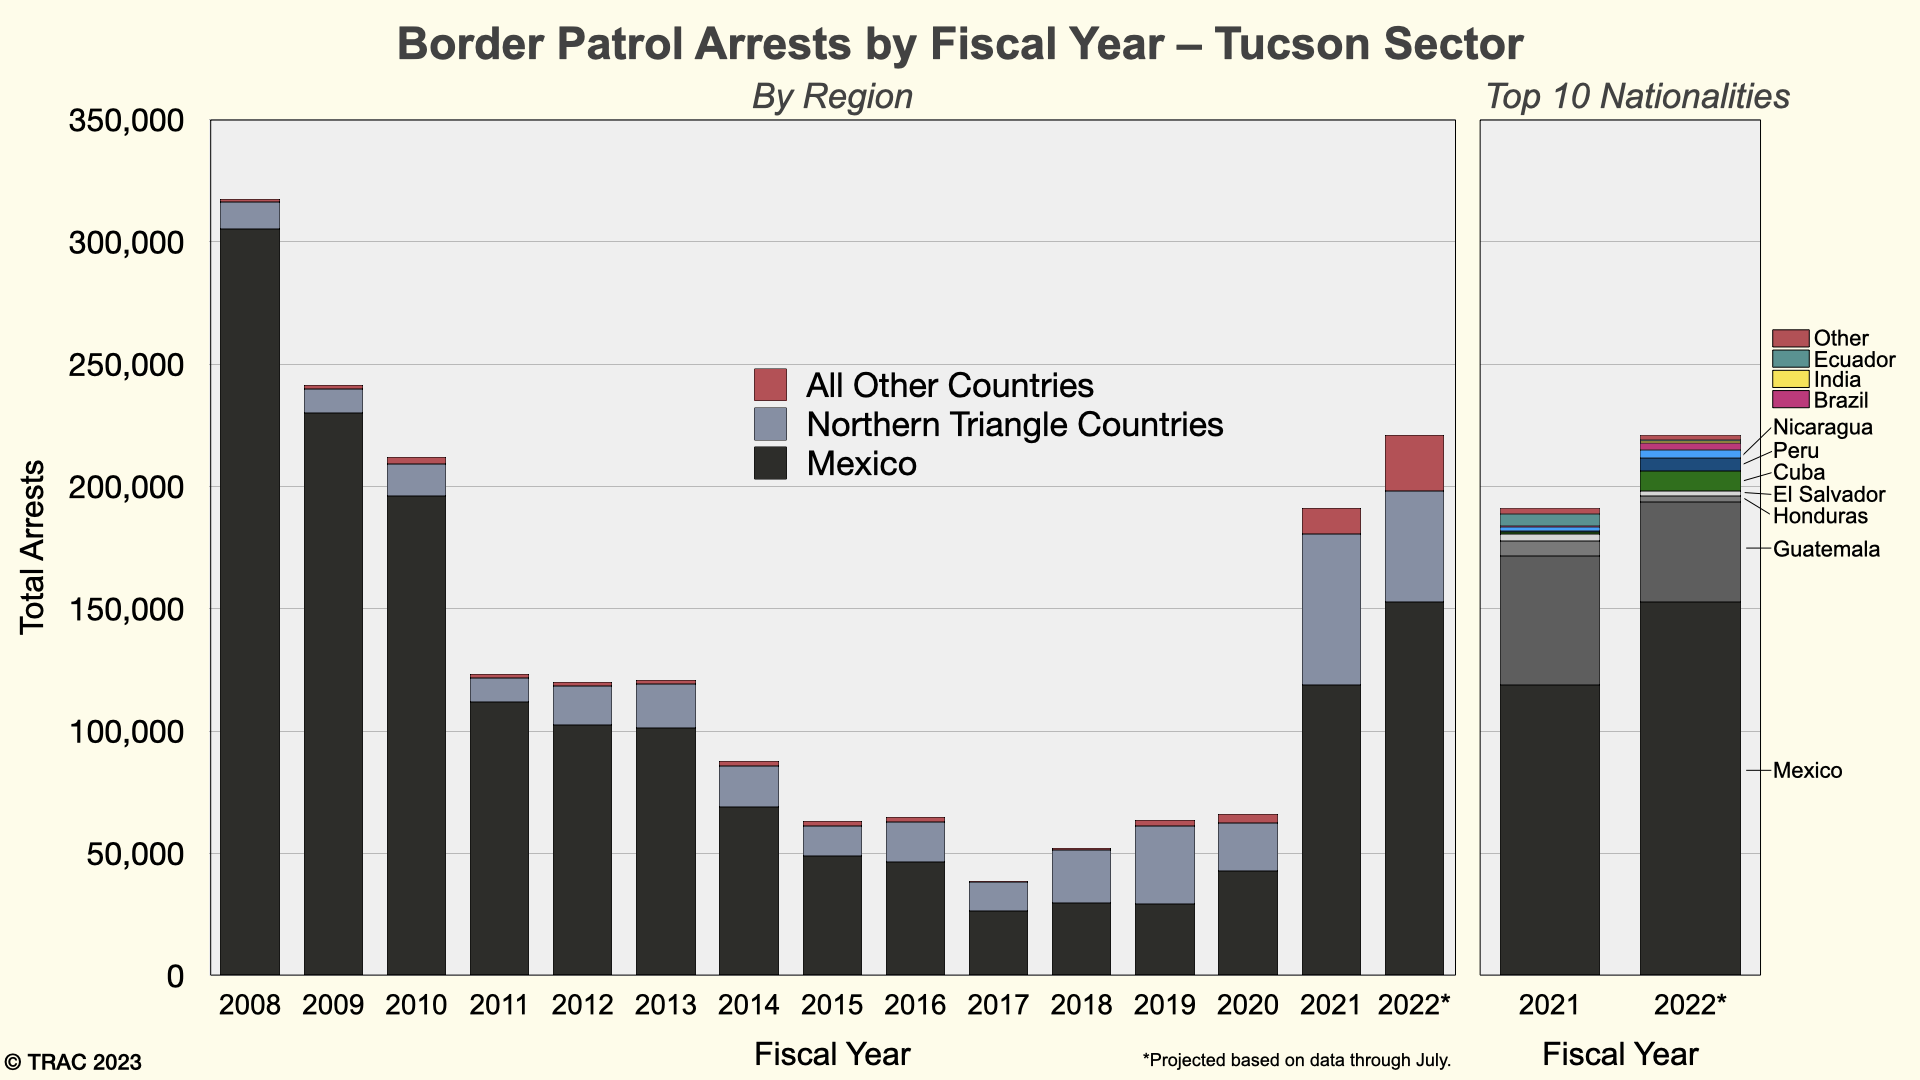
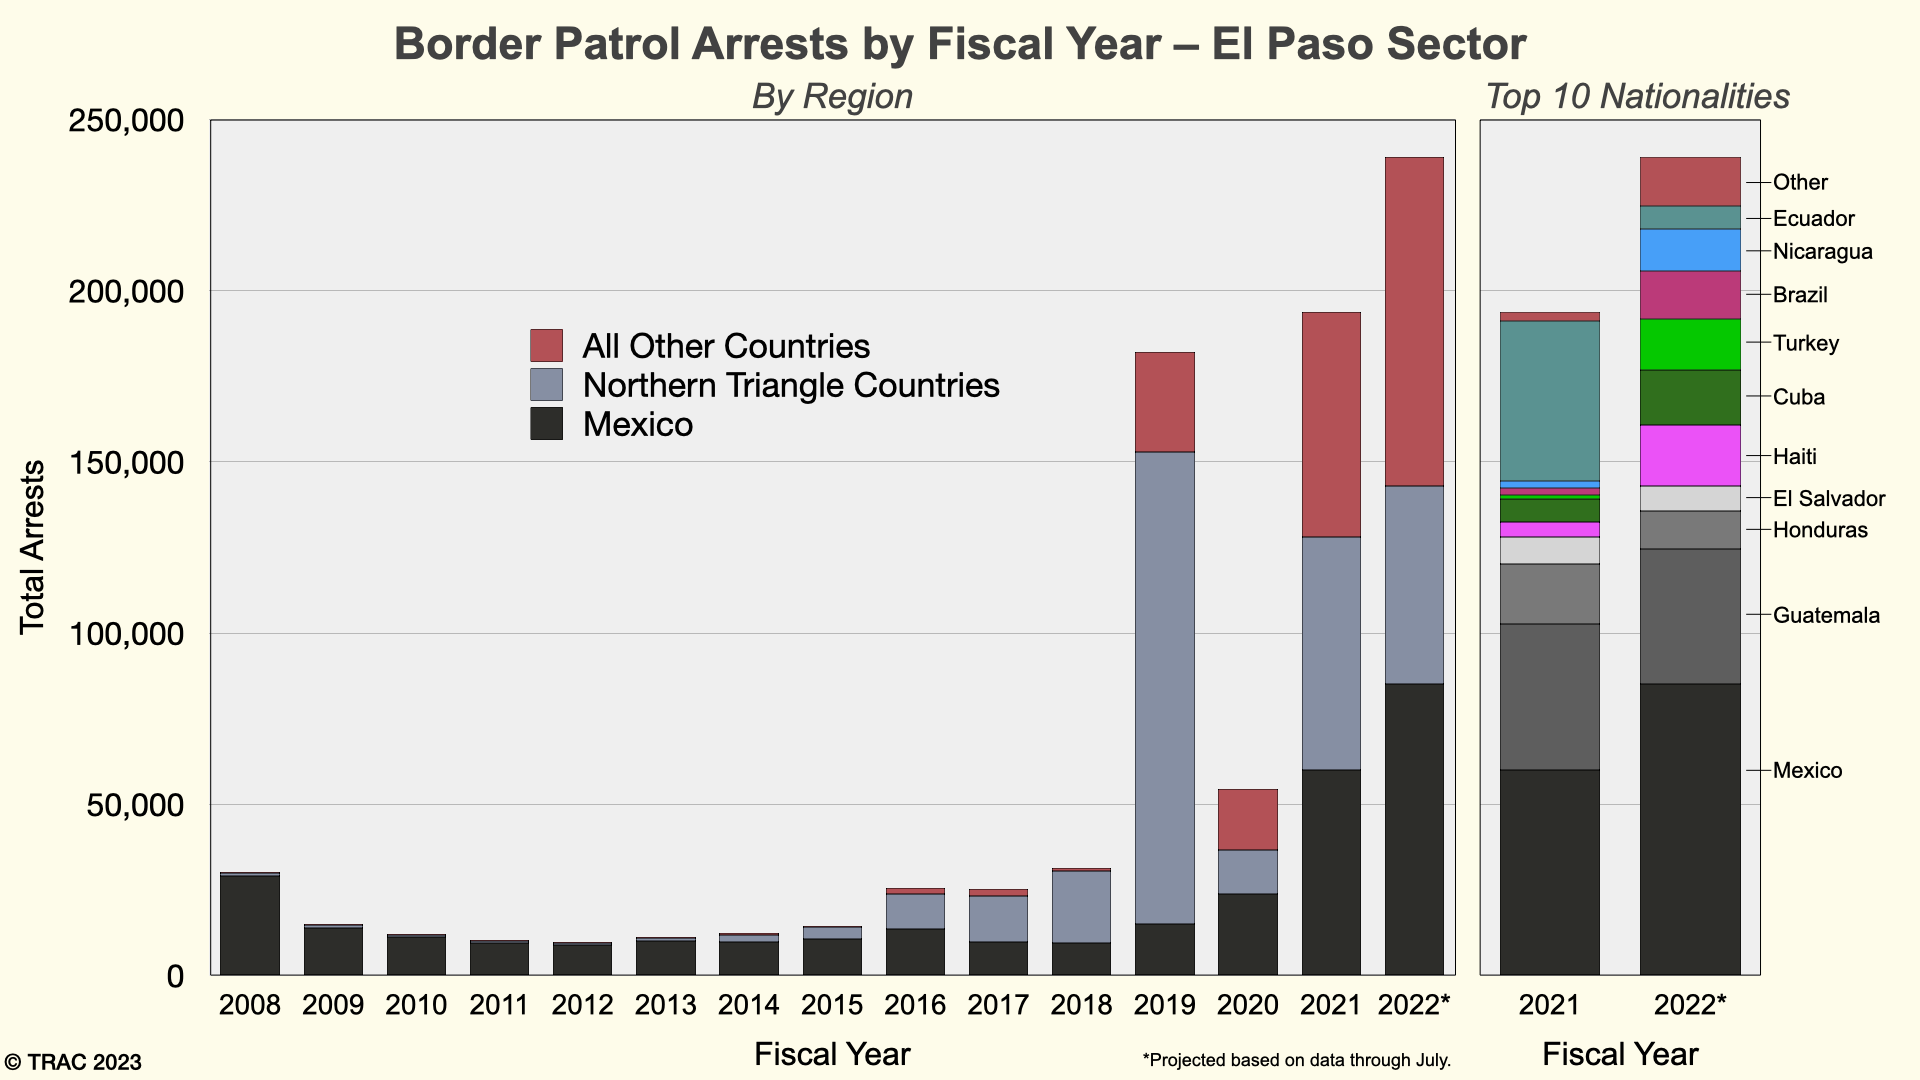
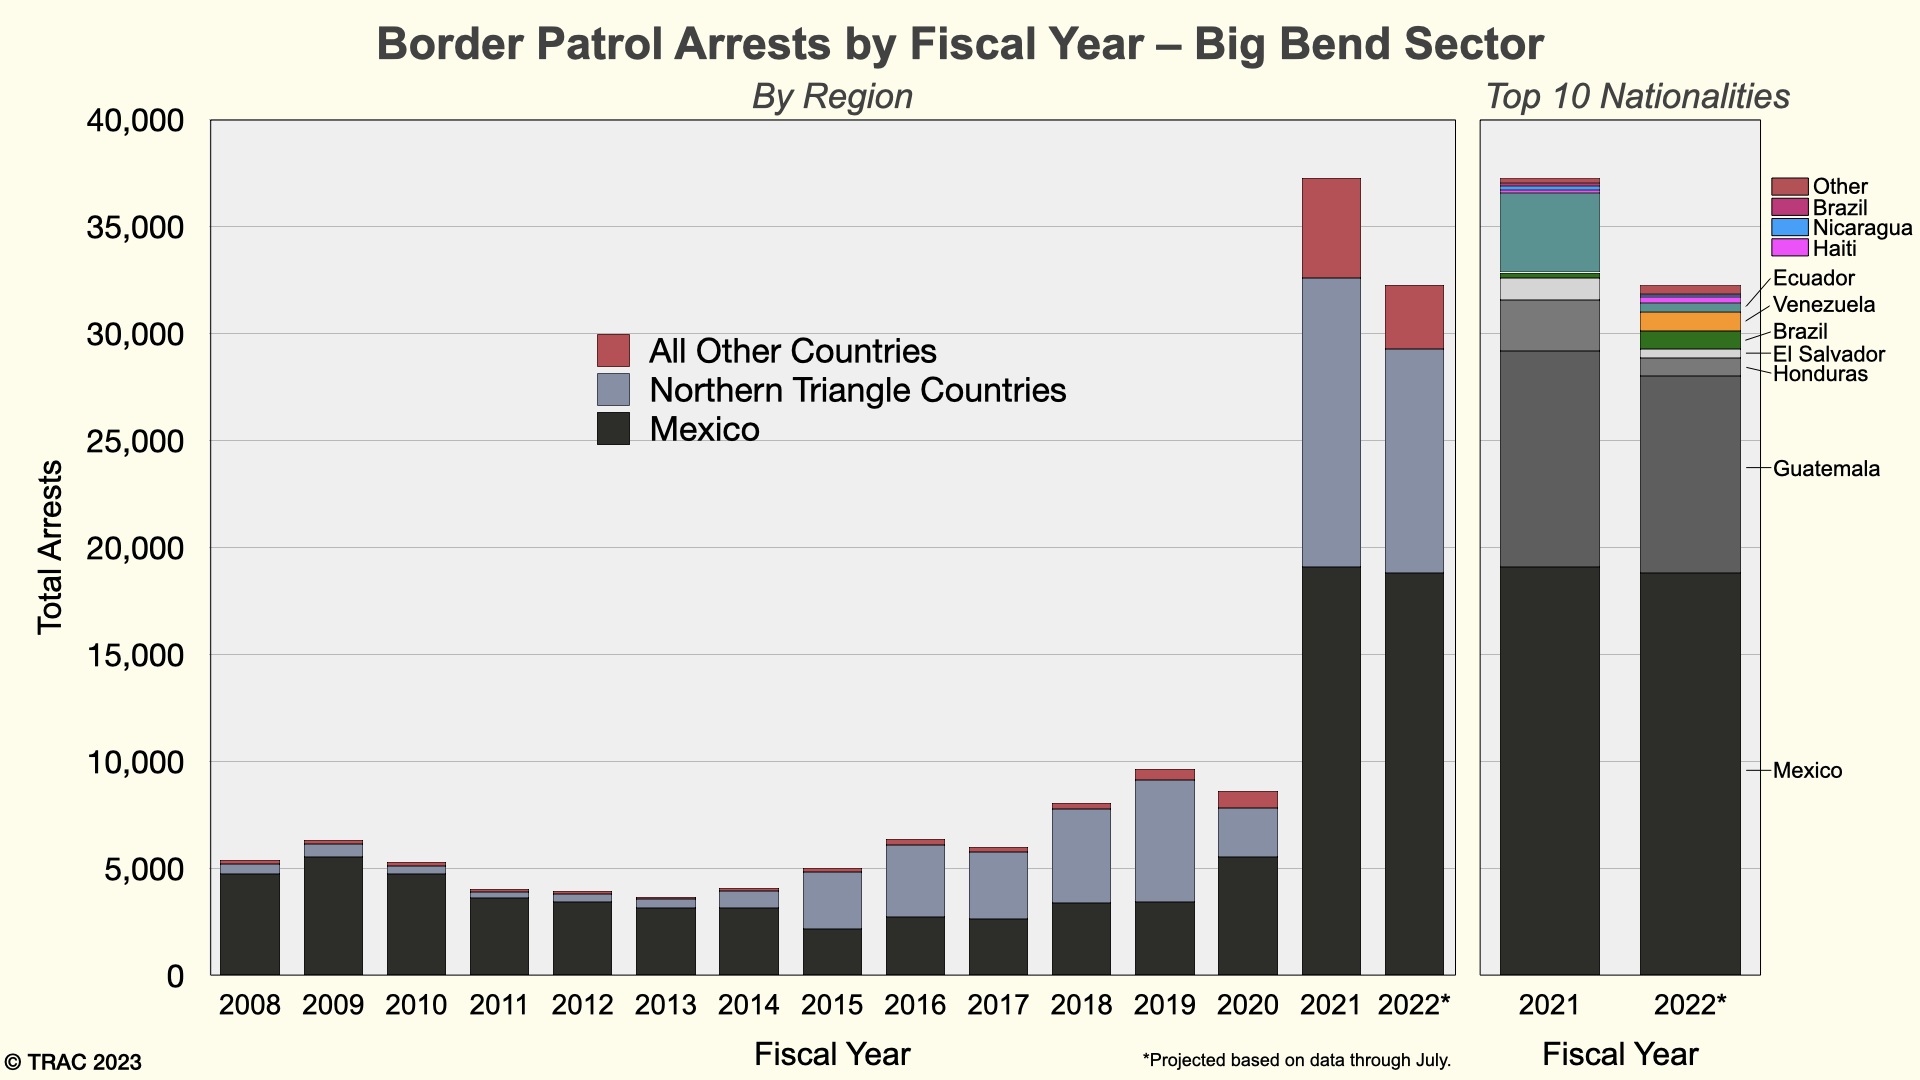
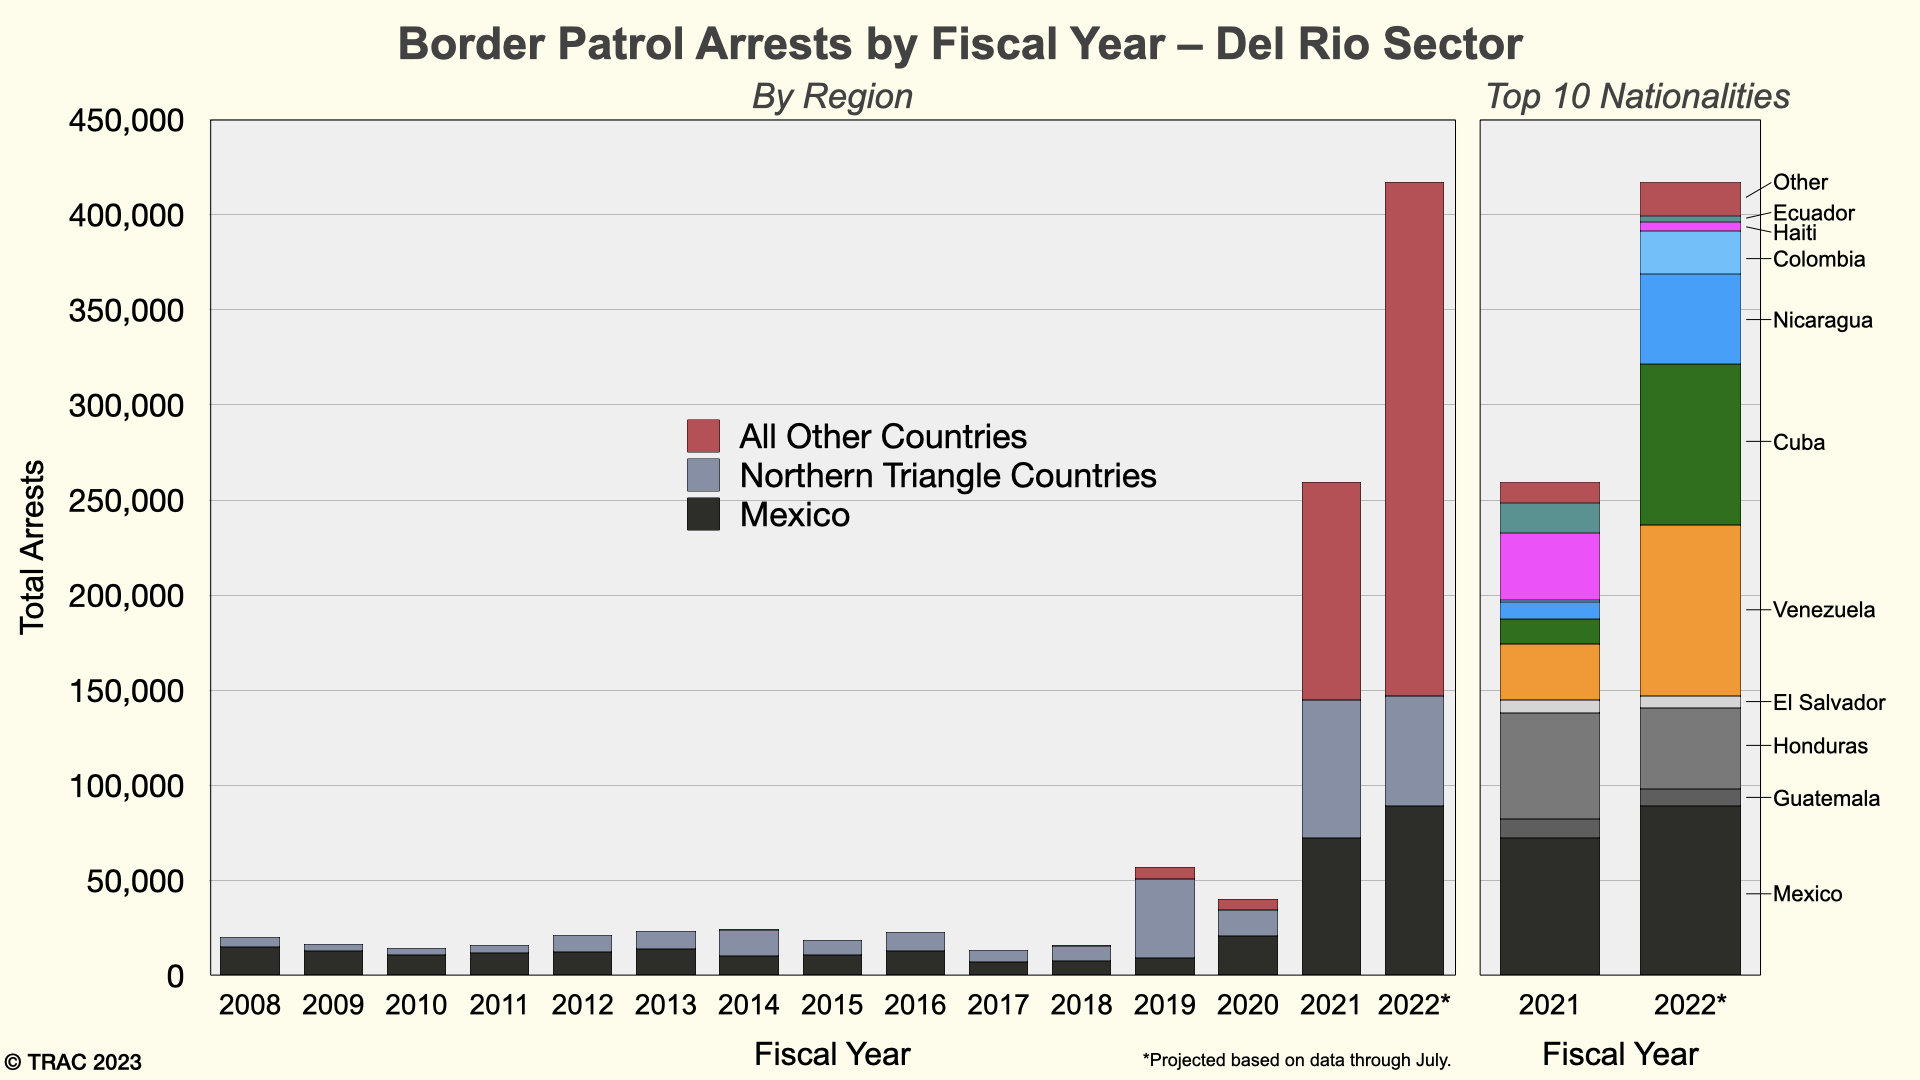
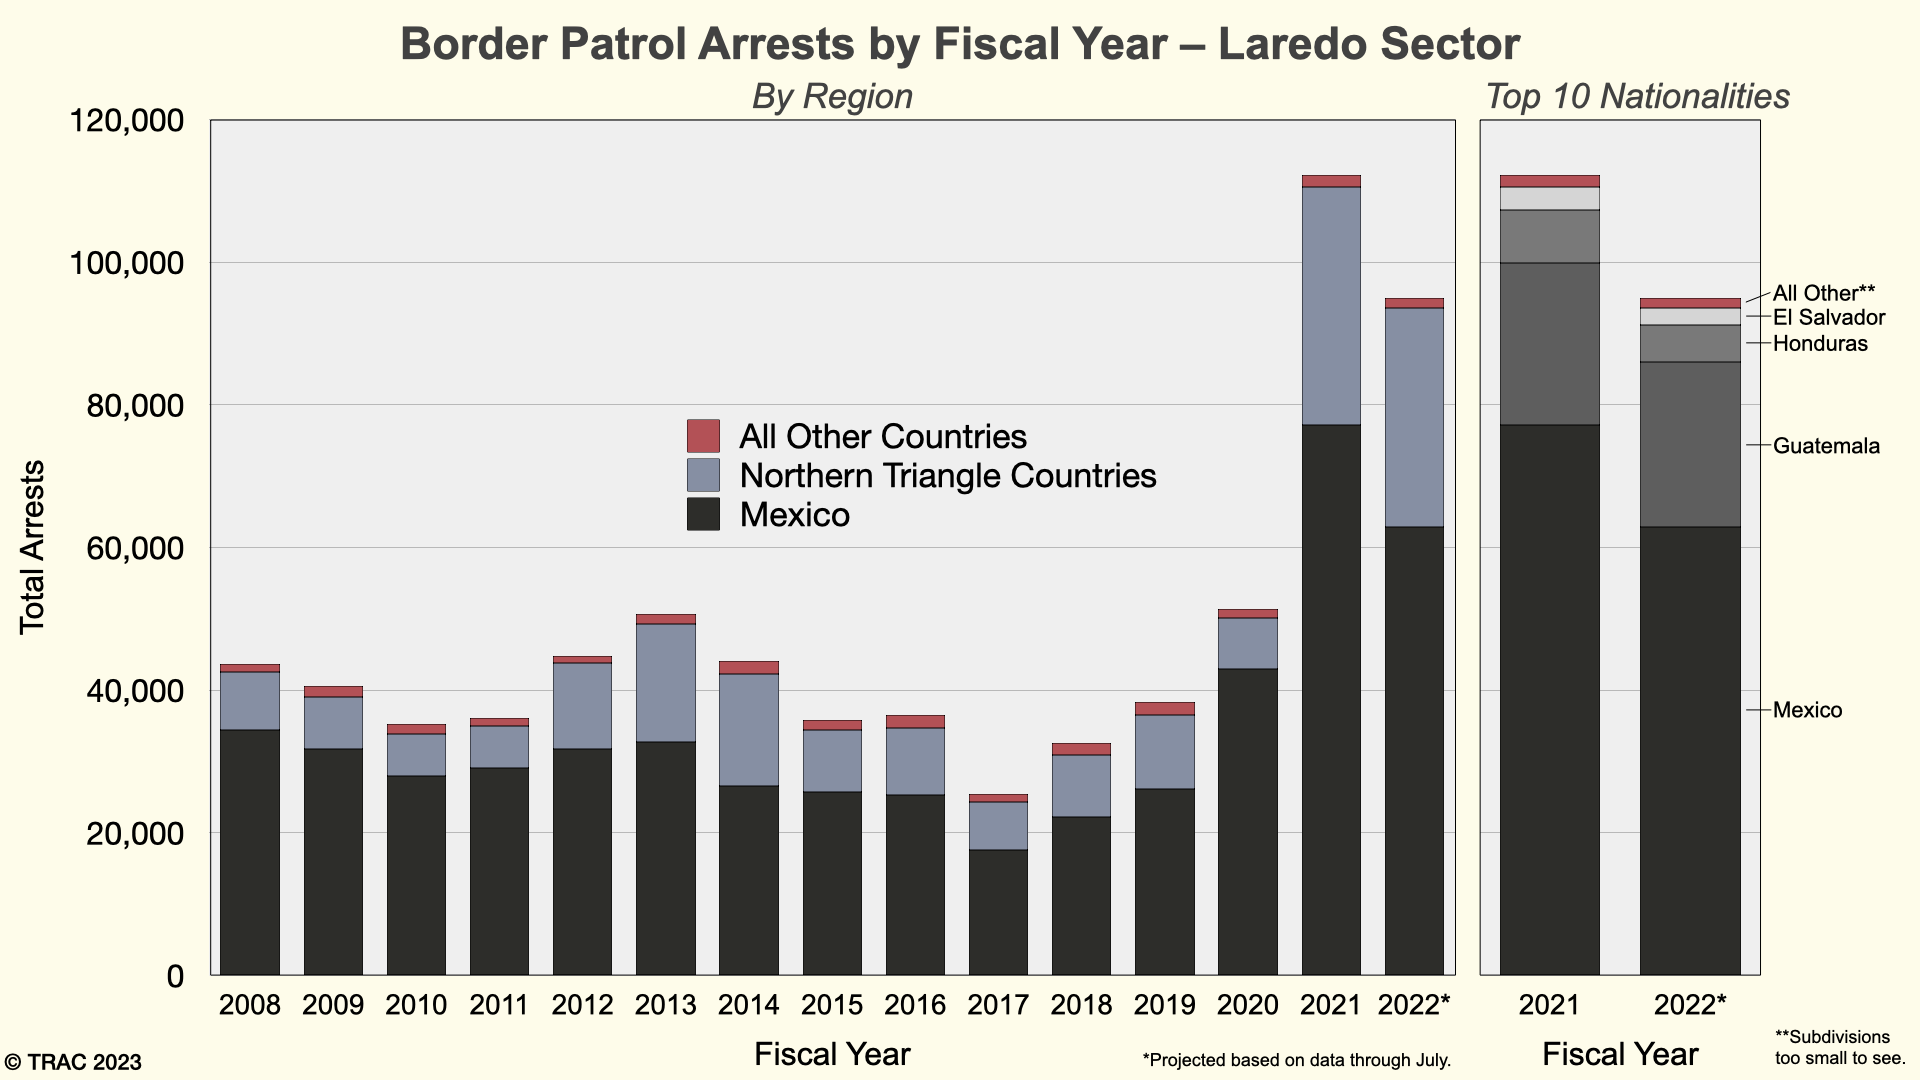
As discussed above, the total number of Border Patrol arrests and the nationalities represented by those arrests show considerable variation across each of the nine sectors. The graphs below show these data with an emphasis on the unique diversification of nationalities in just the past two years running from west to east. Each graph identifies the top ten most frequent nationalities arrested by Border Patrol over the life of the data (FY 2008 to FY 2022, with FY 2022 being projected based on data through the end of July).
The Yuma and Del Rio sectors have seen tremendous overall growth in arrests in the past two years compared to historical trends, and these two, along with El Centro and El Paso, have seen tremendous diversification in recent years. Yuma, for instance, saw about as many arrests of Brazilian nationals and migrants from Mexico and the Northern Triangle countries. Del Rio has seen large numbers of migrants from Cuba and Venezuela. By contrast, the Laredo, Tucson, and Big Bend Sectors have seen little of the diversification experienced by other sectors or by the Southwest Border as a whole.
Some nationalities stand out. Border Patrol has arrested a notable number of Indian nationals, although these tend to be concentrated in Southern California and southwest Arizona in the San Diego, El Centro, and Yuma sectors. Border Patrol has also arrested larger numbers of migrants from Turkey and Haiti in the El Paso sector compared to other sectors, while Nicaraguan and Brazilian migrants make up a significant number of arrests in several sectors along the entire border. San Diego, notably, saw a significant number of arrests of Romanian migrants in FY 2022.
Conclusion
As the data on Border Patrol arrests in this report show, not only has the breakdown in total border arrests varied remarkably over the past decade, but the composition by nationality has also changed dramatically—and changed in a way that is reflected in geographically specific ways along the length of the U.S.-Mexico border. Because these data only go through July 2022, this report does not reflect changes that have occurred in the past year. However, this report lays the groundwork for recognizing sector-by-sector trends in total arrests and the nationality of those arrests going forward. Detailed data on Border Patrol arrests can be found at TRAC’s online Border Patrol Arrest tool here.