Prison Sentencing Patterns for Drug Offenses in U.S. District Courts
Published Sep 13, 2023
Convictions for drug offenses make up a significant portion of federal judges’ sentencing workload. Over the five-year period from July 2018 to June 2023, 18 percent of all convictions were for drug crimes. This is the second only to convictions for immigration offenses.[1]
This criminal caseload is handled by both regular Article III judges appointed to life terms, and magistrate judges who are appointed to shorter terms. Magistrate judges assist district court judges in the work and handle criminal sentencing in less serious cases. Focusing just on district court (“Article III“) judges, drug cases formed an even larger proportion – 27 percent – of their sentencing workload.
This report looks in detail at district court judge sentencing patterns for drug offenses across the country using a detailed accessible database which TRAC compiles tracking federal sentencing records for each judge.[2] For a description of the origins of this TRAC database, see the 2012 article in the Federal Sentencing Reporter.[3] Detailed reports on each judge have just been updated through June 2023 and can be found at TRAC’s Judge Information Center.
Drug Offenses and Typical Federal Sentences Vary Across Judicial Districts
This study focused on sentencing patterns in 40 large federal courthouses. A list of these courthouses is found in Table 1 and includes all federal courthouses where there were at least five district court judges serving throughout the five-year period who each had sentenced at least 30 defendants for drug offenses. The average number of sentences each judge handed down for drug crimes during this period was 106, or about 21 per year, and the median prison sentence for these was 60 months (5 years).
Courthouses in Table 1 are listed in order by their median drug sentence. Judges at the Indianapolis courthouse in the Southern Indiana District handed out the longest median sentences, 120 months, or double the national median, followed by Tampa with a median sentence of 96 months. Meanwhile, Tucson judges issued the shortest median sentences, 18 months, or about a third of the national median. The courthouses in San Diego (27 months) and Bridgeport (30 months) also dispensed drug sentences at or below half of the national median.[4]
Most federal drug offenses are defined in the Controlled Substances Act or the Controlled Substances Import and Export Act. Drug offenses can range from simple possession to conducting a continuing criminal enterprise under what is commonly referred to as the “Drug Kingpin Statute.” The mandatory minimum for simple possession of a controlled substance even with 1 prior conviction is 15 days. While under the drug kingpin statute the minimum is 20 years and can range up to a life sentence.[5]
Given the large list of statutory drug offenses, the make-up of the drug offenses prosecuted can vary greatly from one federal district to another. So too, prison sentences can vary across courthouses. Variation in socio-economic conditions across different communities in the United States will naturally be expected to influence the nature of drug crimes in a community that are prosecuted.
| Federal Courthouse* | Judicial District | Drug Convictions | Drug Convictions/All Convictions | Median Prison Sentence (months) |
|---|---|---|---|---|
| Indianapolis | INS | 281 | 33.3% | 120 |
| Tampa | FLM | 1,119 | 45.1% | 96 |
| Birmingham | ALN | 448 | 32.5% | 84 |
| Kansas City | MOW | 939 | 30.8% | 84 |
| Minneapolis | MN | 240 | 32.4% | 84 |
| Norfolk | VAE | 288 | 30.0% | 82.5 |
| Atlanta | GAN | 520 | 25.2% | 78 |
| Dallas | TXN | 1,466 | 36.9% | 78 |
| Oklahoma City | OKW | 642 | 38.8% | 78 |
| Miami | FLS | 1,122 | 29.2% | 68 |
| Hato Rey, Puerto Rico | PR | 1,534 | 43.4% | 66 |
| Richmond | VAE | 280 | 29.3% | 66 |
| Alexandria | VAE | 370 | 27.6% | 60 |
| Baltimore | MD | 383 | 25.8% | 60 |
| Detroit | MIE | 521 | 22.9% | 60 |
| Ft. Lauderdale | FLS | 438 | 24.0% | 60 |
| Greenbelt | MD | 185 | 17.5% | 60 |
| Little Rock | ARE | 837 | 38.2% | 60 |
| Memphis | TNW | 495 | 28.5% | 60 |
| Mobile | ALS | 447 | 36.7% | 60 |
| Philadelphia | PAE | 576 | 27.6% | 60 |
| Seattle | WAW | 383 | 42.8% | 60 |
| Cleveland | OHN | 945 | 42.6% | 58 |
| Denver | CO | 674 | 35.0% | 57 |
| St. Louis | MOE | 894 | 22.9% | 51.5 |
| Los Angeles | CAC | 703 | 30.8% | 48 |
| Salt Lake City | UT | 1,060 | 34.5% | 48 |
| Columbus | OHS | 381 | 31.6% | 46 |
| Pittsburgh | PAW | 778 | 44.6% | 46 |
| Albuquerque | NM | 519 | 13.4% | 41 |
| Portland | ME | 332 | 48.0% | 40 |
| Boston | MA | 472 | 30.6% | 37 |
| Hartford | CT | 406 | 58.8% | 37 |
| Newark | NJ | 477 | 29.0% | 37 |
| Manhattan | NYS | 1,274 | 39.3% | 36.5 |
| Phoenix | AZ | 627 | 8.4% | 33 |
| Portland | OR | 508 | 32.7% | 33 |
| Bridgeport | CT | 322 | 41.6% | 30 |
| San Diego | CAS | 7,369 | 45.3% | 27 |
| Tucson | AZ | 1,486 | 12.2% | 18 |
Geography and population size impact caseloads, too. Judges working out of the courthouse located in Salt Lake City, a mid-size city by population in the United States, sentenced over a thousand drug offenders -- far more than the number of sentences dispensed in courthouses located in Chicago (441) or Houston (279), two of the most populated cities in the country.[6]
In general, relative to population size, many districts without large urban centers have higher federal drug prosecutions relative to their population size than districts with large metropolitan centers. For example, in looking at the per capita drug convictions by federal judicial district for the first nine months of FY 2023, the ten districts with the highest level of federal drug convictions per capita include North Dakota, both the Southern and Northern District of West Virginia, Alaska, Montana, Eastern and Western Tennessee, New Mexico, and Nebraska.[7] Often the same drug offense can be prosecuted at the local, state, or federal level. Referrals to the feds to prosecute can occur because local authorities consider their statutes don’t impose a high enough penalty compared to what is available under federal provisions, or because law enforcement offices there feel they don’t possess the resources needed.
Judge-to-Judge Variation in Drug Sentences
The analysis presented in this section takes advantage of the broad institutional promise that criminal cases are assigned on a random basis to judges within the same courthouse. Assuming a reasonably large number of cases, random assignment should ensure that the composition of the cases each judge hears will be roughly comparable. Just as this methodology helps determine whether medical treatments have any real impact on patient outcomes, in a similar fashion random assignment provides the most reliable method for isolating the influence of a particular judge’s sentencing practices from the impact of all of the multitude of other factors impacting sentence outcome, including the nature and seriousness of the crime and the defendant’s personal history.
Figure 1 illustrates sentencing variation for drug convictions within each of the courthouses listed in Table 1. Courthouses are listed from those that had the most difference among judges in the median sentence range to courthouses with the least variation. Here what is measured is how far each judge’s median sentence is from the median at that courthouse. Thus, zero (symbolized by the red vertical line) represents when a judge’s typical sentence is the same as that of the judge’s courthouse. The judges working out of each courthouse are represented by black dots. The blue bars extend between the highest and lowest median sentence among the judges working in each respective courthouse.
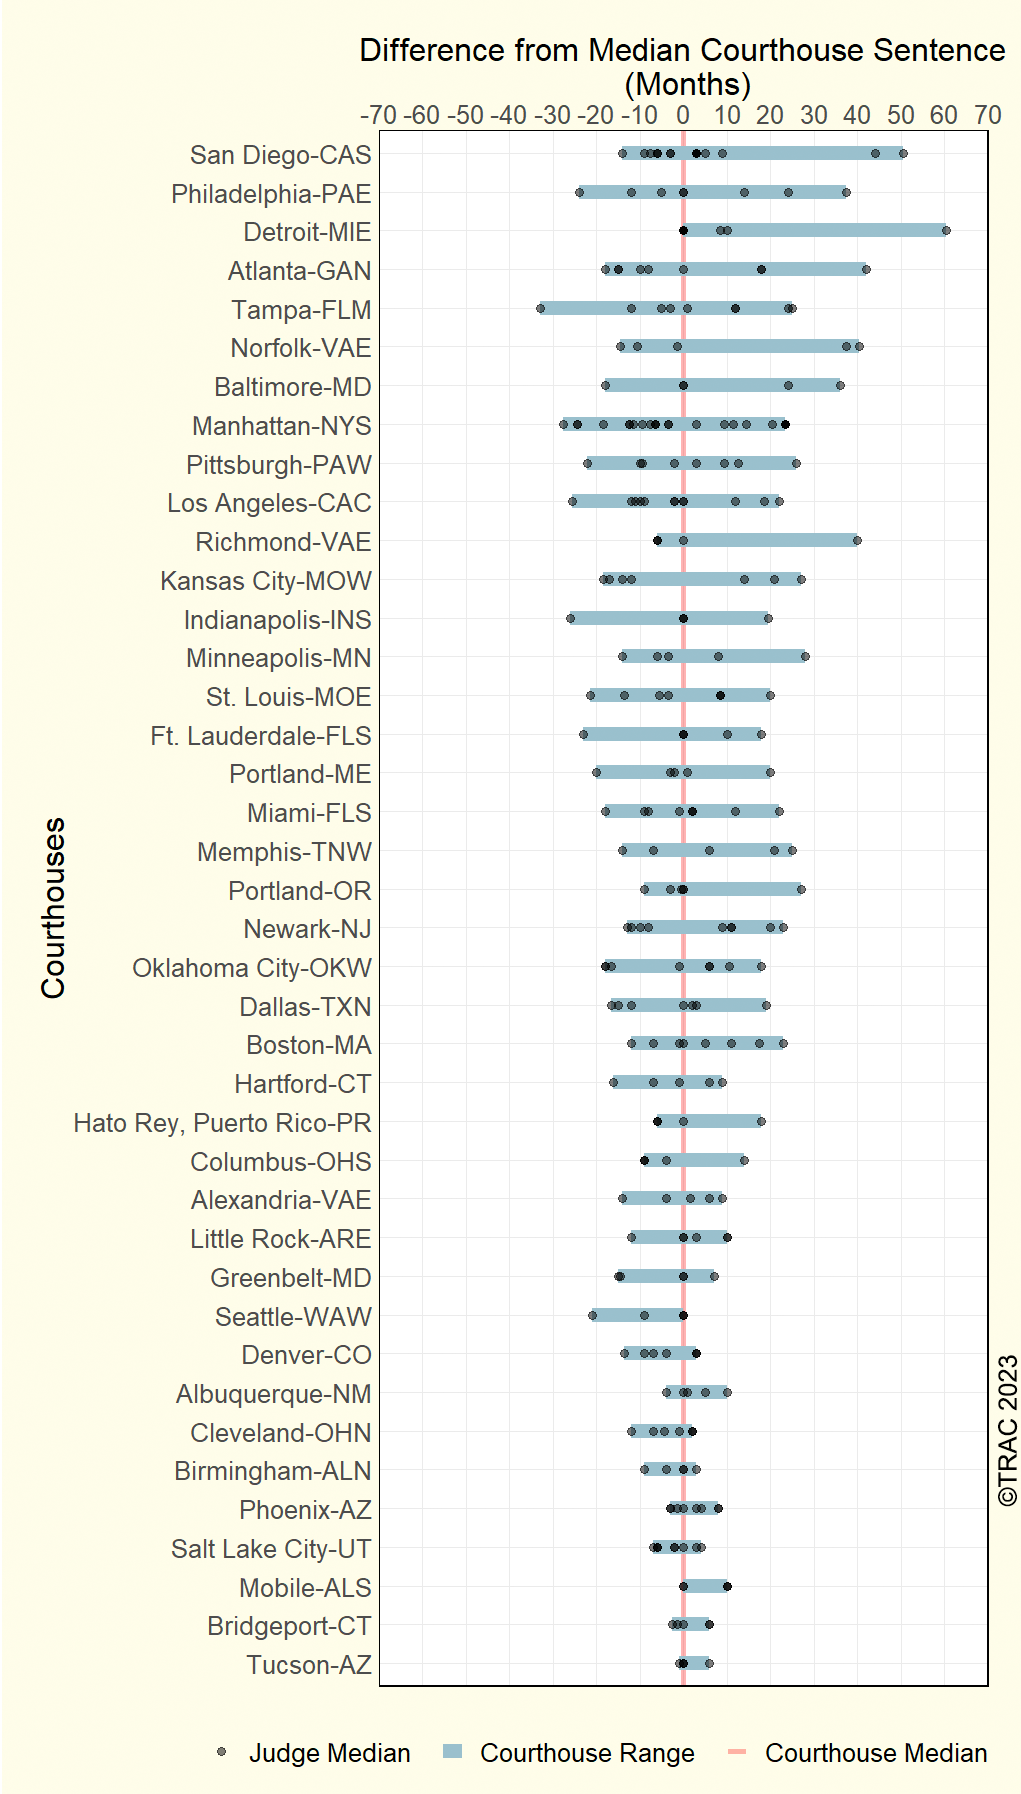
San Diego had the widest variation of any courthouse in this dataset. Among the 17 judges included in this analysis, the San Diego-based judge with the highest median sentencing length on drug cases--Judge Roger T. Benitez--typically dispensed sentences that were 77.5 months in length while Judge Ruth Bermudez Montenegro’s median sentence was 13 months, a difference of 64.5 months. This contrasts with San Diego’s variation in TRAC’s 2012 study, when the difference between the judges with the highest and lowest median sentence for drug cases was 12.0 months.
By contrast, all five judges in Tucson had medians within a 6-month range. In Bridgeport, Connecticut the range was 8.5 months and in Mobile, Alabama, 10 months separated the lowest median sentencer from the highest.
A third example of courthouse variety can be seen in Philadelphia, where more than one judge issued shorter or longer sentences than other peers. Judge Richard Barclay Surrick and Judge Cynthia M. Rufe sentenced convicted drug offenders to a median of 4 years or less while their colleagues Judge Gerald Austin McHugh Jr. and Judge Gerald John Pappert each issued median sentences of over 7 years. Table 2 below features another way to look at this sentencing variation.
Conclusion
A key requirement for achieving justice is that the judges in a court system have sufficient discretion to consider the totality of circumstances in deciding that a sentence in a specific case is "just." No set of rules, including the federal sentencing guidelines, can substitute for this necessary flexibility.
But a fair court system also requires "equal justice" under the law. This means that the average or typical sentences of the judges will not be widely different for similar kinds of cases.
Achieving both a just and, at the same time, a fair criminal justice system is challenging. This report’s goal is to provide judges, the courts, and the public with accurate information to aid in the continuing work to strive towards a more just and fair sentencing system.
For more information, please see TRAC’s individual judge-by-judge reports on 833 U.S. District Court judges, including more detailed information on each of the judges covered in this study.
| Federal Courthouse* | Judicial District | Number of Judges* | Courthouse Median Prison Sentence | Lowest Judge Median Sentence Months | Highest Judge Median Sentence Months | Range |
|---|---|---|---|---|---|---|
| San Diego | CAS | 17 | 27 | 13 | 77.5 | 64.5 |
| Philadelphia | PAE | 8 | 60 | 36 | 97.5 | 61.5 |
| Detroit | MIE | 9 | 60 | 60 | 120.5 | 60.5 |
| Atlanta | GAN | 9 | 78 | 60 | 120 | 60 |
| Tampa | FLM | 9 | 96 | 63 | 121 | 58 |
| Norfolk | VAE | 5 | 82.5 | 68 | 123 | 55 |
| Baltimore | MD | 5 | 60 | 42 | 96 | 54 |
| Manhattan | NYS | 24 | 36.5 | 9 | 60 | 51 |
| Pittsburgh | PAW | 8 | 46 | 24 | 72 | 48 |
| Los Angeles | CAC | 12 | 48 | 22.5 | 70 | 47.5 |
| Richmond | VAE | 5 | 66 | 60 | 106 | 46 |
| Indianapolis | INS | 5 | 120 | 94 | 139.5 | 45.5 |
| Kansas City | MOW | 7 | 84 | 65.5 | 111 | 45.5 |
| Minneapolis | MN | 5 | 84 | 70 | 112 | 42 |
| St. Louis | MOE | 8 | 51.5 | 30 | 71.5 | 41.5 |
| Ft. Lauderdale | FLS | 6 | 60 | 37 | 78 | 41 |
| Miami | FLS | 9 | 68 | 50 | 90 | 40 |
| Portland | ME | 5 | 40 | 20 | 60 | 40 |
| Memphis | TNW | 5 | 60 | 46 | 85 | 39 |
| Newark | NJ | 9 | 37 | 24 | 60 | 36 |
| Oklahoma City | OKW | 8 | 78 | 60 | 96 | 36 |
| Portland | OR | 6 | 33 | 24 | 60 | 36 |
| Dallas | TXN | 7 | 78 | 61.5 | 97 | 35.5 |
| Boston | MA | 8 | 37 | 25 | 60 | 35 |
| Hartford | CT | 5 | 37 | 21 | 46 | 25 |
| Hato Rey, Puerto Rico | PR | 5 | 66 | 60 | 84 | 24 |
| Alexandria | VAE | 5 | 60 | 46 | 69 | 23 |
| Columbus | OHS | 5 | 46 | 37 | 60 | 23 |
| Greenbelt | MD | 5 | 60 | 45 | 67 | 22 |
| Little Rock | ARE | 6 | 60 | 48 | 70 | 22 |
| Seattle | WAW | 5 | 60 | 39 | 60 | 21 |
| Denver | CO | 7 | 57 | 43.5 | 60 | 16.5 |
| Albuquerque | NM | 5 | 41 | 37 | 51 | 14 |
| Cleveland | OHN | 7 | 58 | 46 | 60 | 14 |
| Birmingham | ALN | 5 | 84 | 75 | 87 | 12 |
| Phoenix | AZ | 8 | 33 | 30 | 41 | 11 |
| Salt Lake City | UT | 9 | 48 | 41 | 52 | 11 |
| Mobile | ALS | 5 | 60 | 60 | 70 | 10 |
| Bridgeport | CT | 5 | 30 | 27.5 | 36 | 8.5 |
| Tucson | AZ | 5 | 18 | 17 | 24 | 7 |