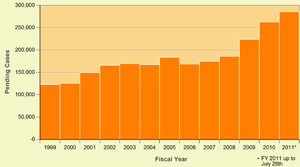
Figure 1. Immigration Court Backlog Click for larger image. |
The number of cases awaiting resolution before the Immigration Courts reached a new all-time high of 285,526 by the end of July 2011, according to very timely government enforcement data obtained by the Transactional Records Access Clearinghouse (TRAC). The case backlog has continued to grow — up 3.7 percent — since TRAC's last report three months ago, and 53 percent higher than levels at the end of FY 2008 (see Figure 1).
Wait times increased since our last report. The average time these pending cases have been waiting in the Immigration Courts of the Executive Office for Immigration Review (EOIR) is now 490 days, compared with 482 days at the beginning of May this year.
Backlog by Charge
A mere 8.3 percent of the pending caseload was made up of "criminal" cases — that is, those charged with criminal activities, actions adverse to national security, or aiding terrorism. This is down from 9.1 percent at the end of fiscal year 2010.
In contrast, 90 percent of the current backlog involved individuals charged with violating immigration rules, e.g., entering the country illegally, entering legally but overstaying their visas, or violating other procedural requirements. This category of pending cases has climbed sharply this year, up from 236,415 at the end of FY 2010 to 259,038 at the end of July 2011.
The average days cases have been pending are longer for individuals facing immigration charges (497 days) compared with those facing criminal charges (410 days). Because cases with immigration charges tend to move through the courts more slowly, they accumulate and thus make up a larger proportion of the pending caseload than of court filings generally. (See TRAC report examining ICE deportation filings by charge. For detailed listing of the actual charges ICE has used, see table.)
Among individual Immigration Courts, Kansas City had the lowest proportion of criminal cases (2.8%), followed by Memphis (3.1%) and Charlotte (3.2%). New York, Harlingen, Baltimore, Denver, Elizabeth, and New Orleans all had 4 percent or fewer criminal cases in their pending workload.
In only two courts — Napanoch (New York) and York (Pennsylvania) — did criminal cases make up more than half of the court backlog. All other courts — whether handling detained or nondetained individuals — had only a minority of criminal cases in their pending caseloads
Full details — by charge, state, nationality, Immigration Court and hearing location — can be viewed in TRAC's backlog application, now updated with data through July 26, 2011.
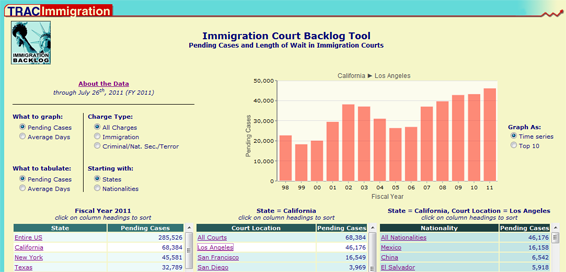
Figure 2. TRAC's Immigration Court Caseload Tool. (click to use the tool) See also TRAC's previous backlog report and listing of earlier TRAC report reports in this series, beginning in 2008 and examining the volume of cases, wait times, as well as the number of immigration judges available. |
Selected Highlights
Wait Times by State
Wait times continue to be longest in California with 666 days, up from 660 days three months ago. Massachusetts average wait times declined to 603 days from 617 days over the same time period. Utah stayed in third place, with an average time of 563 days pending cases have been waiting in the Salt Lake City Immigration Court — up from 537 days three months ago.
Wait Times by Nationality
Among nationalities, and limiting comparisons to the 50 countries with the most individuals in queue, Armenians with cases pending before the Immigration Courts have had the longest wait times of 923 days — almost twice the national average of 490 days. Other nationalities within the top five in terms of the length their cases had been pending were Indonesia (844), Albania (671), Pakistan (642) and Iran (641).
Highest Growth Rates in Pending Cases
Among individual Immigration Courts, and considering only those with at least 1,000 pending cases, the court with the fastest buildup during FY 2011 was the Immigration Court in Oakdale, Louisiana, where pending cases jumped by 45 percent. The San Antonio, Texas court ranked second, with a growth spurt of 40 percent during this year. New Orleans, Louisiana (up 33 percent), Houston, Texas (up 31 percent), and Phoenix, Arizona (up 28 percent) made up the remaining top five locations experiencing the highest growth rates in case backlogs. Las Vegas, Nevada just missed out being included in these ranks with a growth rate of 27 percent.
Courts With Declining Case Backlogs
Some courts, however, saw a decline in their number of pending cases during the first nine months of FY 2011. Again considering only courts with at least 1,000 pending cases, the court with the sharpest decline was in New York Varick Street, New York. That court saw its backlog reduced by 39 percent. This was followed by the Guaynabo, Puerto Rico court where the pending caseload dropped by 26 percent during this fiscal year. The Houston Service Processing Center in Texas dropped by 15 percent, Salt Lake City in Utah by 10 percent, and Baltimore, Maryland by 8.5 percent.