Foreclosure Lawsuits Continue to Rise
| Number Latest Month | 505 |
|---|---|
| Percent Change from previous month | 12.7% |
| Percent Change from 1 year ago | 32.7% |
| Percent Change from 5 years ago | -25.1% |
The latest available data from the federal courts show that during March 2016 the government reported 505 new foreclosure civil filings. According to the case-by-case information analyzed by the Transactional Records Access Clearinghouse (TRAC), this number is up 12.7 percent over the previous month when the number of civil filings of this type totaled 448. The comparisons of the number of civil filings for foreclosure-related suits are based on case-by-case court records which were compiled and analyzed by TRAC (see Table 1).
When TRAC last reported on this matter, foreclosure lawsuits had declined from a peak reached in May and June of 2012 but seemed to have bottomed out in January 2014. Indeed, as can be seen in Figure 1, the monthly count remained relatively stable from that point until about a year ago. When foreclosure civil filings for March 2016 are compared with those of the same period in the previous year, their number was up by nearly one third, or 32.7 percent. Filings for March 2016 are still substantially lower than they were for the same period five years ago however. Overall, the data show that civil filings of this type are down 25.1 percent from levels reported in March 2011.
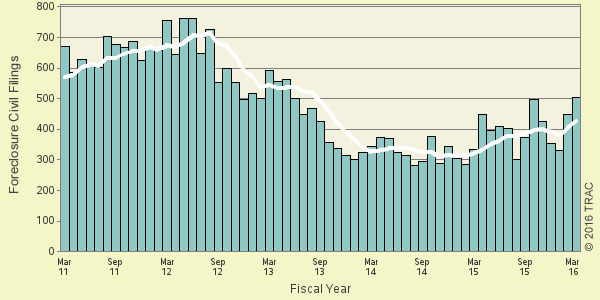
Figure 1. Foreclosure Civil Filings Over the Last Five Years
The long term trend in foreclosure civil filings going back five years is shown more clearly in Figure 1. The vertical bars in Figure 1 represent the number of foreclosure civil filings recorded each month. The superimposed line on the bars plots the six-month moving average so that natural fluctuations are smoothed out. One-year and five-year change comparisons are based upon the moving averages.
Top Ranked Judicial Districts
Relative to population, the volume of civil matters of this type filed in federal district courts during March 2016 was 1.6 per every million persons in the United States. One year ago the relative number of filings was 1.1. Understandably, there is great variation in the per capita number of foreclosure civil filings in each of the nation's ninety-four federal judicial districts. Table 2 ranks the ten districts with the greatest number of foreclosure lawsuits filed per one million population during March 2016.
(per One Million People)
| Judicial District | Percapita | Count | Rank | 1yr ago | 5yrs ago |
|---|---|---|---|---|---|
| Nevada | 15.9 | 45 | 1 | 1 | 4 |
| R. I. | 4.7 | 5 | 2 | 2 | 27 |
| Ill, S | 4.7 | 6 | 3 | - | 3 |
| Fla, N | 3.9 | 7 | 4 | - | 40 |
| Ken, E | 3.7 | 8 | 5 | - | 8 |
| Ken, W | 3.6 | 8 | 6 | 44 | 22 |
| Vermont | 3.2 | 2 | 7 | 12 | - |
| Ga, N | 3.1 | 20 | 8 | 14 | 1 |
| Cal, C | 2.9 | 56 | 9 | 8 | 7 |
| Texas, N | 2.4 | 17 | 10 | 7 | 17 |
The District of Nevada — with 15.9 civil filings as compared with 1.6 civil filings per one million people in the United States — was the most active through March 2016. The District of Nevada was ranked first a year ago, while it was ranked fourth five years ago.
The District of Rhode Island ranked second and also ranked second a year ago.
The Southern District of Illinois now ranks third.
Recent entries to the top 10 list were Vermont, the Northern District of Georgia (Atlanta) and the Western District of Kentucky (Louisville), which are ranked seventh, eighth and sixth, respectively.
The federal judicial district which showed the greatest growth in the rate of foreclosure civil filings compared to one year ago — up 700 percent — was the Western District of Kentucky. Compared to five years ago, the district with the largest growth — 239 percent — was the Northern District of Florida.
Each month, TRAC offers a free report focused on one area of civil litigation in the U.S. district courts. In addition, subscribers to the TRACFed data service can generate custom reports by district, office, nature of suit or federal jurisdiction via the TRAC Data Interpreter.