After Two Year Decline, Foreclosure Civil Filings Beginning to Rise
Number Latest Month 374 Percent Change from previous month 9.0% Percent Change from peak (June 2012) -49.1% Percent Change from 5 years ago 35.5%
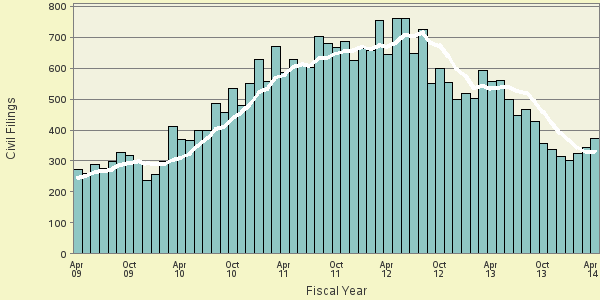
Table 1. Foreclosure Civil FilingsThe latest available data from the federal courts show that during April 2014 the government reported 374 new foreclosure civil filings. This is only half of the peak monthly level of such lawsuits filed in May and June of 2012. The comparisons of the number of civil filings for foreclosure-related suits are based on case-by-case court records which were compiled and analyzed by TRAC (see Table 1).
The fall in foreclosure filings may have bottomed out, since this is the third straight month that filings have increased since dropping to 302 new cases in January of this year. According to the case-by-case information analyzed by the Transactional Records Access Clearinghouse (TRAC), foreclosure filings in April were up 9.0 percent over the previous month, when the number of civil filings of this type totaled 343, and up by 23.8 percent over January's low. It is too soon to tell however if increases in the last three months represents the start of an upward trend.
Foreclosure lawsuits are still more than a third higher (up 35.5%) from the level five years ago in April 2009. These long term trends in foreclosure civil filings are shown more clearly in Figure 1. The vertical bars in Figure 1 represent the number of foreclosure civil filings recorded each month. The superimposed line on the bars plots the six-month moving average so that natural fluctuations are smoothed out.
Top Ranked Judicial Districts
Relative to population, the Eastern District of Kentucky (Lexington), Rhode Island, and the Northern District of Georgia (Atlanta) led the nation in the volume of civil foreclosure cases filed in federal district courts during April 2014. Table 2 lists the ten most active districts for such cases in per capita terms in April 2014.
Judicial District Percapita Count Rank 1yr ago 5yrs ago Ken, E 15.2 33 1 8 4 R. I. 7.6 8 2 1 - Ga, N 4.2 27 3 3 15 Okla, E 2.7 2 4 - 9 Texas, E 2.4 9 5 25 44 Texas, S 2.4 21 6 20 48 New Hamp 2.3 3 7 17 - Ken, W 2.3 5 8 35 7 Ill, N 2.2 21 9 2 49 Delaware 2.2 2 10 - -
Table 2. Top Ten Districts (per One Million People)
The Eastern District of Kentucky — with 15.2 civil filings as compared with 1.2 civil filings per one million people in the United States — was the most active through April 2014. The Eastern District of Kentucky was ranked eighth a year ago, while it was ranked fourth five years ago.
The District of Rhode Island ranked second, while it was ranked first a year ago.
The Northern District of Georgia now ranks third; it was also ranked third a year ago.
Recent entries to the top 10 list were New Hampshire, the Southern District of Texas (Houston), the Eastern District of Texas (Tyler) and the Western District of Kentucky (Louisville).
The federal judicial district which showed the greatest growth in the rate of foreclosure civil filings compared to one year ago — 312.5 percent — was the Eastern District of Kentucky. Compared to five years ago, the district with the largest growth — 2016.6 percent — was the Northern District of Illinois.
In the last year, the judicial District Court recording the largest drop in the rate of foreclosure civil filings — 83.7 percent — was Rhode Island. But over the past five years, the Western District of Kentucky showed the largest drop — 18.9 percent.
Each month, TRAC offers a free report focused on one area of civil litigation in the U.S. district courts. In addition, subscribers to the TRACFed data service can generate custom reports by district, office, nature of suit or federal jurisdiction via the TRAC Data Interpreter.
Report Date: May 29, 2014