Use of ICE Detainers: Obama vs. Trump
The latest case-by-case Immigration and Customs Enforcement data reveal that its use of detainers, commonly called immigration holds, began to increase last year well before either the election or inauguration of Donald Trump. Once President Trump assumed office, detainer usage rose rapidly. By March 2017, the second full month of the Trump Administration, ICE recorded preparing 13,971 detainers - up 31.7 percent from January's level.
Against a longer time frame, the number of detainers issued in March of 2017 is still slightly lower than during March of 2014. It is also only half the level of six years ago (March 2011) when ICE detainer usage peaked. See Figure 1.
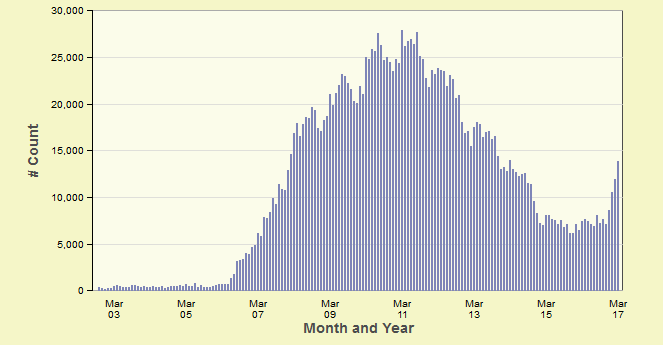
Figure 1. Immigration Detainers by Month
TRAC's detainer report series examines the role ICE I-247s have played in effectuating actual deportations. ICE detainers have frequently been used to ask local police and sheriffs to hold individuals booked into local jails beyond when they would ordinarily be released. In theory, their purpose is to allow ICE time to take the individuals into custody. But in a surprisingly high proportion of occasions this never occurs.
A number of myths have grown up around the use of ICE detainers. Detainers are often characterized as being the main tool that ICE needs to apprehend suspects it seeks to deport. Detainer usage climbed in the waning years of the Bush Administration, and expanded rapidly under President Obama. However, results from their widespread use during the last two administrations never lived up to expectations. They provided a surprisingly small contribution to ICE's actual deportations.
Detainer usage was severely cut back in 2014 when much more targeted and selective enforcement policies were instituted by the Obama Administration. Now the Trump Administration has resurrected widespread use of detainers, and is pressuring local law enforcement agencies to comply.
In reporting on this topic, the Transactional Records Access Clearinghouse (TRAC) at Syracuse University sought to examine whether the effectiveness of the detainer program shows any improvement under President Trump when judged against this administration's stated goals. TRAC found the agency surprisingly reticent to reveal how detainers now are actually being used. This has left many questions unanswered.
The Data and TRAC's Revised Detainer App
Results presented here are based upon TRAC's analysis of agency records on over two million ICE detainers prepared from October 2002 through March 2017 during the Bush, Obama, and Trump Administrations. The Center obtained these data in a series of separate releases in response to over fifty individual Freedom of Information submissions, and a successful lawsuit against the agency. Three additional lawsuits in federal court are currently ongoing. Each lawsuit seeks formerly public information ICE is now withholding covering recent time periods[1].
Accompanying this report, a revised web-based application allows the public to drill into these data to examine where detainers are now being sent - to each state, county, and individual law enforcement agency (LEA). Information is separately compiled for each month, as well as year by year, to make it easier to determine how targeting has recently changed. The revised app also includes information on the gender and citizenship of individuals who are the subject of these detainers.
Current information in agency files recording when detainers are refused is also included. It is important to emphasize that ICE itself now admits that this data field is inaccurate and unreliable. Users therefore should be cautious in placing any faith in these particular numbers. ICE apparently believes that the field is so error prone that it discontinued issuing its "detainer refused" report that was based on this field.
TRAC's original version of its detainer app can also be viewed. While it doesn't include any data on the current administration, it continues to contain much greater information on detainer usage during the Bush and Obama years. Data available include the criminal records along with the ages of persons targeted by detainers, whether the agency actually took the individual into custody, and (in a companion app), whether these detainers resulted in actual deportations.
ICE Detainer Requests,
February - March 2017
| Detainer Requests | Law Enforcement Agencies | |
| Number of LEAs | Cumulative Percent | |
| 1 | 642 | 29.1% |
| 2 | 363 | 45.5% |
| 3 | 195 | 54.4% |
| 4 | 161 | 61.7% |
| 5 | 126 | 67.4% |
| 6-9 | 260 | 79.2% |
| 10-19 | 199 | 88.2% |
| 20-29 | 91 | 92.3% |
| 30-39 | 38 | 94.0% |
| 40-49 | 32 | 95.5% |
| 50-74 | 33 | 97.0% |
| 75-99 | 22 | 98.0% |
| 100-149 | 23 | 99.0% |
| 150-199 | 10 | 99.5% |
| 200-299 | 6 | 99.7% |
| 300 or more | 6 | 100.0% |
| Total | 2,207 | |
2,207 Law Enforcement Agencies Sent New ICE Detainer Requests
The new data provide details on the specific law enforcement agencies sent ICE detainers. During February and March of 2017, ICE prepared detainers addressed to some 2,207 different law enforcement agencies. About three out of ten (29.1%) received a single detainer request during this two-month period. Over half (54.4%) received up to three requests. Only one in five out of the 2,207 LEAs received ten or more requests. See Table 1.
The largest number of law enforcement agencies receiving ICE detainers during these two months were located in Texas. In that state alone ICE records listed 286 different law enforcement agencies sent detainers. California had the next highest total with 206 different law enforcement agencies that were recipients. Georgia had the third highest with 105 of its local police, sheriff's and other law enforcement agencies recorded as receiving detainer requests during this two-month period. The other states in the top five were Florida (98 LEAs) and New York (85 LEAs). Some of these detainers were addressed to federal correctional facilities that happened to be located in these states.
The line-up of states shifts, however, if the focus is on the actual number of ICE detainers, rather than the number of LEAs receiving them. California then tops the list racking up 5,292 detainer requests, followed by Texas with 5,091, and Florida with 1,431.
Georgia has the fourth highest total of ICE detainers requests (1,365), these were sent to 105 individual law enforcement agencies. Arizona had the fifth highest number of detainers, with 1,298 noted in ICE records during February and March of 2017. Corresponding figures for the remaining states can be found in Table 2.
The 100 LEAs Sent the Most ICE Detainers
A total of 100 law enforcement agencies received fifty or more detainer requests from ICE during February and March of this year. However, because these agencies received the highest volume of requests they alone accounted for half (50.0%) of all ICE detainers ICE recorded as prepared during this two-month period. These top 100 agencies are listed in Table 3.
Topping this list was the Harris County Jail in Texas - the county Houston is located in. To the extent ICE records reliably record this information, the Harris County Jail was sent 738 of these immigration holds. This averages out to almost 13 ICE detainer forms arriving each day.
ICE records indicate that the Los Angeles County Jail received the second highest number of detainer requests. According to the records ICE provided TRAC, the agency prepared 696 detainer requests addressed to this one jail. In third place was the Maricopa County Jail in Arizona where Phoenix is located. It was sent a total of 501 detainer requests during February and March of 2017.
(click title to open in a new window)
| State or Territory | Detainer Requests | Law Enforcement Agencies |
| TEXAS | 5,091 | 286 |
| CALIFORNIA | 5,292 | 206 |
| GEORGIA | 1,365 | 105 |
| FLORIDA | 1,431 | 98 |
| NEW YORK | 1,070 | 85 |
| ILLINOIS | 370 | 74 |
| NORTH CAROLINA | 839 | 72 |
| TENNESSEE | 383 | 62 |
| ALABAMA | 302 | 57 |
| VIRGINIA | 572 | 57 |
| MISSOURI | 154 | 50 |
| MINNESOTA | 285 | 47 |
| WASHINGTON | 461 | 47 |
| PENNSYLVANIA | 469 | 46 |
| OKLAHOMA | 552 | 45 |
| SOUTH CAROLINA | 459 | 45 |
| COLORADO | 420 | 44 |
| KANSAS | 164 | 44 |
| OHIO | 217 | 44 |
| WISCONSIN | 178 | 44 |
| ARKANSAS | 199 | 43 |
| LOUISIANA | 263 | 42 |
| IOWA | 149 | 39 |
| ARIZONA | 1,298 | 37 |
| MICHIGAN | 143 | 36 |
| INDIANA | 170 | 35 |
| NEW JERSEY | 709 | 35 |
| MASSACHUSETTS | 214 | 33 |
| KENTUCKY | 122 | 31 |
| MISSISSIPPI | 334 | 31 |
| OREGON | 189 | 30 |
| MARYLAND | 238 | 28 |
| NEW MEXICO | 84 | 25 |
| NEBRASKA | 122 | 24 |
| NEVADA | 446 | 23 |
| IDAHO | 128 | 22 |
| CONNECTICUT | 87 | 20 |
| UTAH | 271 | 16 |
| WYOMING | 37 | 16 |
| SOUTH DAKOTA | 34 | 12 |
| HAWAII | 16 | 10 |
| MONTANA | 13 | 9 |
| NEW HAMPSHIRE | 61 | 8 |
| WEST VIRGINIA | 60 | 8 |
| MAINE | 11 | 7 |
| NORTH DAKOTA | 19 | 7 |
| ALASKA | 7 | 4 |
| DELAWARE | 29 | 4 |
| GUAM | 27 | 4 |
| PUERTO RICO | 22 | 3 |
| DISTRICT OF COLUMBIA | 12 | 2 |
| RHODE ISLAND | 13 | 2 |
| NORTHERN MARIANA ISLANDS | 4 | 1 |
| VERMONT | 1 | 1 |
| VIRGIN ISLANDS | 6 | 1 |
| Facility Name Not Listed | 387 | |
| 25,999 | 2207 |
The Dallas County Jail according to ICE records was sent the fourth highest total with 432 separate detainer forms addressed to jail officials there. The Gwinnett County Jail -located 30 miles northeast of Atlanta, Georgia -- was in fifth place with 416 detainer requests.
Rounding out the top ten recipients of ICE detainers during the first two full months of the Trump Administration were: Hidalgo County Jail in Texas (321), the Los Angeles City Jail in California (292) the ASPC Alhambra in Maricopa County, Arizona (272), Taft Federal Correctional Institution in Kern County California (271), and the Orange County Jail in California (260),
Table 3 also shows comparative numbers for the detainers received at each of these same facilities during January 2017 so that the impact facility-by-facility of President Trump's new policies can be more readily seen. (Complete month by month figures are available in the new detainer app.
Also for comparison purposes, the detainers prepared back in March of 2014 are also listed in Table 3. This is when detainer totals nationally were slightly higher than the levels in March of 2017. However, for both the Harris County Jail and the Los Angeles County Jail, these facilities received even more detainer requests in March 2017 than they had three years earlier. In contrast, the opposite was true for the Maricopa County Jail in Arizona. Maricopa County Jail received 324 detainers back in March of 2014 but only 260 in March of 2017.
ICE's Current Campaign To Hide Information on Its Detainer Program
Because of the agency's withholding, there are a surprising number of questions that the new data can't answer on ICE detainer practices during the Trump Administration. Among basic information now being withheld, as mentioned above, are any details on the criminal records for the subjects of these detainers. Thus, we can't tell how many detainers were issued on individuals without any criminal record, or how many were lodged for noncitizens who had only been convicted of petty or minor offenses.
Also being withheld is information on whether ICE actually took these individual into custody after issuing a detainer, or ultimately deported them. All of this information had been routinely released in response to TRAC's past FOIA requests. The last ICE release that contained this information was made as recently as January of this year.
Given the past failures of ICE's detainer program to achieve its stated goals, success of the Trump Administration's policies cannot be assumed. For example, stepped up issuance of detainers could be an empty exercise if it outstrips the staffing available to actually take individuals into custody. It could be counter-productive if it clogs the deportation pipeline with individuals who pose little threat to public safety while diverting attention from attending to and deporting those individuals actually convicted of committing serious crimes.
Rather than trumpeting their accomplishments, ICE officials are carrying out a puzzling campaign to hide what their detainer efforts are achieving. The initial reason agency officials gave to explain why data fields had mysteriously disappeared from the data files TRAC received was perplexing. The exact words in ICE's response to our administration appeal to the Office of Principal ICE Legal Advisor were:
"In response to your FOIA request, ICE provided the data fields from the Enforcement Integrated Database (EID) that are responsive to your request. To the extent your request seeks ICE to provide additional data sets, those data fields do not exist in EID."
Thus, ICE did not assert the information was somehow exempt from disclosure. Rather it essentially claimed that the agency had retained no record of whether individuals were taken into custody after a detainer was issued; that it did not know anything about whether anyone targeted by a detainer had ever been arrested or what they had been charged or convicted of; and it did not have any record of whether any of these individuals were ever deported.
TRAC's co-directors then sued the agency challenging the truthfulness of these claims. After suit was filed, agency officials changed their story. Yes, they admitted the information existed. Their new claim? Because these details were recorded in different database tables, the agency didn't feel obligated to retrieve it and was now refusing to do so.
While we continue to challenge this unlawful withholding in court, we sent off a series of separate requests limiting the data fields to those contained in any one request to a single ICE database table. This would then obviate any need to fetch data from more than one database table at a time. We also limited our request to a narrow time period to make it simpler to respond.
However, the agency has now refused to process even these new requests. It simply administratively closed each request without bothering to conduct any search.
So we appealed again. The agency's final response from its Office of Chief Legal Advisor arrived last week. Again the agency switched gears and came up with a new reason for its refusal to retrieve the requested data. The agency now claims it couldn't process our requests because officials were unable to remember where to look to find information on which individuals it had booked into its detention facilities, or just who the agency had recently deported.
Despite the fact that our requests cited the specific previous agency FOIA response (by the agency's own tracking number) when it had provided exactly this information, and our letter had included the precise name the agency itself had used for this data field, the agency now claims:
"Under the FOIA, it is a statutory requirement that a requester reasonably describe the requested records. 5 U.S.C. § 552(a)(3)(A). You must describe the records that you seek in enough detail to enable Department personnel to locate them with a reasonable amount of effort. 6 C.F.R. § 5.3(b). ... Upon a complete review of the administrative record, ICE has determined that your request ... does not reasonably describe identifiable records."
The public might well ask, what exactly the agency is so determined to hide?
| Rank | State | County and Facility | ICE Detainers Prepared | ||||
| March 2014 | January 2017 | February 2017 | March 2017 | Feb-Mar 2017 | |||
| 1 | Texas | Harris County - Harris County Jail | 368 | 279 | 334 | 404 | 738 |
| 2 | California | Los Angeles County - Los Angeles County Jail | 324 | 184 | 317 | 379 | 696 |
| 3 | Arizona | Maricopa County - Maricopa County Jail | 324 | 240 | 241 | 260 | 501 |
| 4 | Texas | Dallas County - Dallas County Jail | 264 | 164 | 206 | 226 | 432 |
| 5 | Georgia | Gwinnett County - Gwinnett County Jail | 202 | 78 | 217 | 199 | 416 |
| 6 | Texas | Hidalgo County - Hidalgo County Jail | 158 | 131 | 167 | 154 | 321 |
| 7 | California | Los Angeles County - Los Angeles City Jail | 126 | 100 | 141 | 151 | 292 |
| 8 | Arizona | Maricopa County - ASPC Alhambra | 193 | 116 | 127 | 145 | 272 |
| 9 | California | Kern County - Taft Fed.Corr.Inst. | 145 | 86 | 131 | 140 | 271 |
| 10 | California | Orange County - Orange County Jail | 182 | 110 | 130 | 130 | 260 |
| 11 | California | San Bernardino County - Fci Victorville | 9 | 21 | 16 | 220 | 236 |
| 12 | Nevada | Clark County - Clark County Det.Center | 83 | 76 | 113 | 111 | 224 |
| 13 | North Carolina | Hertford County - Rivers Correctional Institution | 22 | 47 | 174 | 19 | 193 |
| 14 | Oklahoma | Oklahoma County - Oklahoma County Jail | 78 | 90 | 102 | 91 | 193 |
| 15 | California | Fresno County - F.C.I. Mendota | 0 | 3 | 3 | 176 | 179 |
| 15 | Mississippi | Adams County - Adams County Det Center | 13 | 12 | 31 | 148 | 179 |
| 17 | Arizona | Maricopa County - US Marshal - Phoenix | 57 | 57 | 42 | 136 | 178 |
| 18 | Texas | Howard County - BSCC Flightline Unit | 332 | 39 | 74 | 94 | 168 |
| 19 | Utah | Salt Lake County - Salt Lake County Jail | 58 | 88 | 62 | 104 | 166 |
| 20 | Florida | Collier County - Collier County Sheriff Facility | 74 | 46 | 80 | 76 | 156 |
| 21 | Pennsylvania | Centre County - Moshannon Valley Correctional | 124 | 217 | 83 | 67 | 150 |
| 21 | Texas | Travis County - Travis Cty Jail | 174 | 65 | 94 | 56 | 150 |
| 23 | Oklahoma | Caddo County - Great Plains Correctional | 0 | 29 | 26 | 116 | 142 |
| 23 | Texas | Bee County - Garza West Transfer Facility | 15 | 56 | 39 | 103 | 142 |
| 25 | California | Santa Barbara County - Santa Barbara County Jail | 21 | 49 | 51 | 86 | 137 |
| 26 | California | Ventura County - Ventura County Jail | 16 | 58 | 63 | 69 | 132 |
| 27 | Georgia | Cobb County - Cobb County Jail | 50 | 44 | 74 | 57 | 131 |
| 28 | California | San Diego County - San Diego County Jail | 37 | 52 | 63 | 66 | 129 |
| 29 | California | San Diego County - Vista Detention Facility | 71 | 33 | 58 | 63 | 121 |
| 30 | Alabama | Pickens County - Aliceville Fci | 17 | 37 | 34 | 85 | 119 |
| 30 | California | San Bernardino County - West Valley | 102 | 56 | 50 | 69 | 119 |
| 32 | New York | Queens County - Rikers Island, Queens, Ny | 139 | 16 | 57 | 58 | 115 |
| 33 | Texas | Jefferson County - Beaumont Fcc, Medium | 18 | 4 | 56 | 58 | 114 |
| 34 | Georgia | Hall County - Hall County Jail | 33 | 25 | 53 | 60 | 113 |
| 34 | Texas | Walker County - Huntsville State P. | 94 | 172 | 40 | 73 | 113 |
| 36 | New York | Queens County - Queens Central Booking | 64 | 1 | 49 | 61 | 110 |
| 37 | North Carolina | Wake County - Wake County Sheriff Dept. | 73 | 58 | 45 | 64 | 109 |
| 37 | Texas | Montgomery County - Montgomery County Jail | 15 | 33 | 59 | 50 | 109 |
| 39 | California | Kern County - Wasco State Prison | 43 | 56 | 48 | 59 | 107 |
| 39 | Nevada | Clark County - City Of Las Vegas Det.Center | 9 | 34 | 47 | 60 | 107 |
| 41 | California | Santa Clara County - Santa Clara County Main Jail | 28 | 37 | 48 | 56 | 104 |
| 42 | North Carolina | Wake County - N.C. Dept Of Corrections | 49 | 50 | 65 | 38 | 103 |
| 43 | Virginia | Manassas City - Prince William Facility | 72 | 49 | 60 | 41 | 101 |
| 44 | California | Fresno County - Fresno County Jail | 40 | 24 | 41 | 59 | 100 |
| 44 | New York | Suffolk County - Suffolk Co.Correc Fac | 54 | 54 | 59 | 41 | 100 |
| 46 | California | San Bernardino County - San Bernardino County Jail | 24 | 21 | 40 | 55 | 95 |
| 47 | California | San Francisco County - San Francisco Co Jail | 33 | 21 | 45 | 49 | 94 |
| 47 | Colorado | Adams County - Adams County Jail | 31 | 20 | 43 | 51 | 94 |
| 49 | Florida | Miami-Dade County - Dade County Correctional | 79 | 26 | 48 | 44 | 92 |
| 49 | New York | Nassau County - Nassau County Correctional Center | 50 | 61 | 51 | 41 | 92 |
| 51 | California | Monterey County - Monterey Co. Jail | 36 | 28 | 33 | 58 | 91 |
| 51 | California | Santa Barbara County - Lompoc U.S. Prison | 24 | 53 | 40 | 51 | 91 |
| 51 | Texas | Tarrant County - Tarrant County Jail | 43 | 21 | 43 | 48 | 91 |
| 54 | New Jersey | Cumberland County - Southwood State Prison | 2 | 4 | 29 | 59 | 88 |
| 54 | Texas | Tarrant County - Mansfield L.E. Center | 6 | 33 | 50 | 38 | 88 |
| 56 | Florida | Hillsborough County - Hillsborough County Jail | 54 | 14 | 33 | 53 | 86 |
| 57 | Texas | Collin County - Collin County Jail | 19 | 20 | 44 | 41 | 85 |
| 58 | California | Riverside County - Riverside County Sheriff | 50 | 39 | 44 | 40 | 84 |
| 59 | California | Alameda County - Santa Rita Jail | 81 | 30 | 32 | 50 | 82 |
| 59 | Minnesota | Hennepin County - Hennepin County Adc | 42 | 34 | 35 | 47 | 82 |
| 61 | Florida | Palm Beach County - Palm Beach County Jail | 34 | 21 | 40 | 41 | 81 |
| 61 | Louisiana | Jefferson Parish - Jefferson Parish Cor. Center | 6 | 24 | 34 | 47 | 81 |
| 63 | Texas | Taylor County - Texas Doc - Middleton Unit | 11 | 41 | 28 | 52 | 80 |
| 64 | Florida | Miami-Dade County - Turner Guiford Knight (Tgk) Jail | 14 | 35 | 36 | 42 | 78 |
| 65 | Texas | Anderson County - Gurney Transfer Facility | 8 | 46 | 30 | 47 | 77 |
| 66 | California | San Mateo County - San Mateo Co Jail | 29 | 24 | 37 | 39 | 76 |
| 67 | Arizona | Pima County - Pima County Jail | 62 | 21 | 32 | 43 | 75 |
| 68 | New York | Kings County - Brooklyn Metropolitan Detention Center | 31 | 21 | 54 | 20 | 74 |
| 69 | Texas | Tarrant County - Arlington Police Dept. | 9 | 34 | 33 | 41 | 74 |
| 70 | Georgia | Clayton County - Clayton County Jail | 12 | 8 | 21 | 52 | 73 |
| 71 | Texas | Walker County - Holliday Transfer Unit | 30 | 52 | 35 | 37 | 72 |
| 72 | Texas | Bexar County - San Antonio (City Of) Magistrate | 64 | 29 | 28 | 43 | 71 |
| 73 | Texas | Cameron County - Candadian County, El Reno | 28 | 24 | 28 | 43 | 71 |
| 74 | Virginia | Fairfax City - Fairfax Co. Adult Detention Center | 2 | 30 | 41 | 30 | 71 |
| 75 | New York | Kings County - Brooklyn Central Booking | 41 | 0 | 47 | 23 | 70 |
| 76 | Colorado | El Paso County - Colo Dept Of Corrections | 21 | 17 | 17 | 52 | 69 |
| 77 | Florida | Leon County - Fl Dept Of Corrections | 33 | 28 | 26 | 41 | 67 |
| 78 | North Carolina | Mecklenburg County - Mecklenburg County Jail Central | 46 | 30 | 35 | 31 | 66 |
| 78 | Oklahoma | Tulsa County - David L. Moss Criminal Justice Center (Jail) | 68 | 39 | 34 | 32 | 66 |
| 80 | California | Tulare County - Tulare County Jail | 42 | 34 | 26 | 38 | 64 |
| 81 | California | Sacramento County - Sacramento County Jail | 29 | 23 | 27 | 36 | 63 |
| 81 | Texas | El Paso County - El Paso County Jail (Tx) | 8 | 11 | 31 | 32 | 63 |
| 81 | Washington | King County - King County Adult Jail | 28 | 25 | 31 | 32 | 63 |
| 84 | Florida | Broward County - Broward County Jail | 34 | 22 | 31 | 31 | 62 |
| 84 | Illinois | Cook County - Cook County Jail | 63 | 16 | 27 | 35 | 62 |
| 86 | South Carolina | Charleston County - Charleston County Correctional Facility | 22 | 9 | 36 | 25 | 61 |
| 87 | California | Contra Costa County - Contra Costa County Jail | 41 | 21 | 32 | 26 | 58 |
| 87 | California | Santa Clara County - Santa Clara Co Jail/Men's | 11 | 20 | 38 | 20 | 58 |
| 87 | Florida | Miami-Dade County - South Florida Recept Cent | 10 | 28 | 24 | 34 | 58 |
| 87 | New York | Westchester County - Westchester Co.Jail,valha | 27 | 10 | 20 | 38 | 58 |
| 91 | Texas | Denton County - Denton County Jail | 18 | 14 | 18 | 39 | 57 |
| 92 | Florida | Martin County - Martin County Jail | 28 | 13 | 34 | 21 | 55 |
| 92 | Texas | Bexar County - Us Marshals,west.Dist.,tx | 32 | 31 | 32 | 23 | 55 |
| 94 | New Jersey | Essex County - Northern State Prison | 0 | 3 | 24 | 29 | 53 |
| 94 | Texas | Concho County - Ci Eden | 127 | 24 | 45 | 8 | 53 |
| 96 | California | Los Angeles County - Los Angeles Police Pd 77th Div. | 14 | 15 | 20 | 32 | 52 |
| 96 | New Jersey | Cumberland County - Southern State Corr. Fac. | 2 | 8 | 15 | 37 | 52 |
| 96 | Texas | Walker County - James H. Byrd Facility | 5 | 12 | 14 | 38 | 52 |
| 99* | California | Sonoma County - Sonoma Co Main Adult Det | 26 | 19 | 26 | 24 | 50 |
| 99* | Florida | Duval County - Duval/Jacksonville Jail | 33 | 12 | 23 | 27 | 50 |
Footnotes
[1] See TRAC's June 2017 suit, May 2017 suit, and February 2014 suit.