Has Cooperation by State and Local Law Enforcement Agencies Improved ICE's Apprehension Numbers?
As a complement to reforms of ICE detainer practices introduced in November 2014 by the Priority Enforcement Program (PEP), Department of Homeland Secretary Jeh Johnson announced a major organized outreach effort to gain back law enforcement agency cooperation. This effort sought to counter the growing unpopularity of DHS's Secure Communities Program. As Johnson noted: "Governors, mayors, and state and local law enforcement officials around the country have increasingly refused to cooperate with the [Secure Communities] program, and many have issued executive orders or signed laws prohibiting such cooperation."[1]
In a December 22, 2015 press release, Secretary Johnson announced that this outreach effort had been quite successful: "Of the 25 largest jurisdictions that had placed restrictions on their own cooperation with ICE, 16 are now working with us again for the good of public safety."
This report, the second in a two-part series, examines the data behind these claims. Detainers sent to local law enforcement officials — often referred to as I-247s after the government form that is used — have historically been a major method Immigration and Customs Enforcement (ICE) employs to take into custody individuals thought to be deportable. TRAC's findings based upon a review of individual detainer records call into question the assumed linkage between cooperation with ICE by state and local law enforcement agencies and ICE's success in apprehending immigrants it seeks to deport.
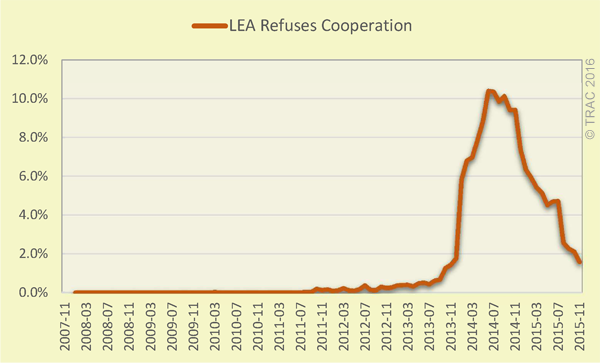
Figure 1. State and Local Law Enforcement Agency (LEA) Refuses ICE I-247 Detainer Request
TRAC's last report documented that ICE still has failed to target its detainer program on noncitizens convicted of significant criminal offenses. This report examines whether ICE actually takes individuals into custody who it targeted with those detainers. Two conclusions emerge:
According to ICE data, DHS outreach efforts have drastically curbed reported refusals by law enforcement agencies to transfer custody of individuals over to ICE. During the first two months of FY 2016 ICE reports only 2 percent of the agency's I- 247 requests were refused. See Figure 1.
While recorded refusal rates fell sharply, the proportion of occasions where ICE took custody of the individual after issuing I-247 requests has not rebounded. Indeed, this rate has continued to decline. It is now below 40 percent. See Figure 2.
The end result is that ICE has not improved its performance through its detainer program in apprehending individuals who the agency seeks to deport. Details for these two findings are discussed in the sections that follow.
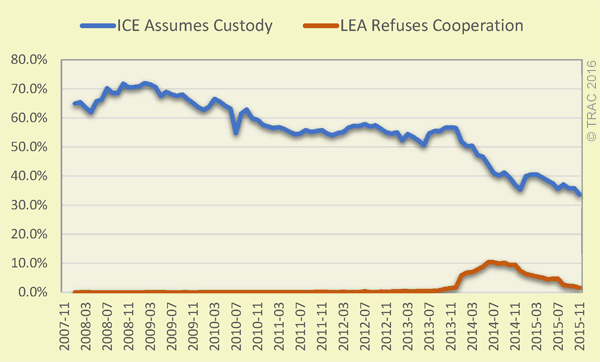
Figure 2. Outcome of ICE I-247 Detainer Requests
Are State and Local Law Enforcement Agencies Now Cooperating with ICE?
Under DHS's Secure Communities program, ICE data recorded a sharp rise in refusals by state and local law enforcement agencies (LEAs). This rise in recorded refusals began in the latter half of 2013, and peaked during the summer of 2014. Then, as shown in Figure 1, refusal rates began falling as DHS discontinued Secure Communities and mounted an aggressive outreach effort.
Thus, these DHS outreach efforts would appear to have drastically curbed refusals to transfer individuals who state and local law enforcement agencies had in custody over to ICE enforcement officers. During the first two months of FY 2016, for example, ICE data indicate only 2 percent of ICE's I-247 requests were refused. This was down from a high of over 10 percent in the months preceding the termination of the Secure Communities program.
However, some caution is warranted before reaching any definitive conclusion. This is because TRAC found serious quality issues in ICE's recording of refusal rates. TRAC notes that ICE apparently does not require that information tracking law enforcement agency refusals be systematically entered in its database. Rather, recording this information is optional. The database field the agency uses records a variety of different reasons why ICE "lifted" — that is withdrew — a custody transfer request.
These recorded "lift" reasons often disagree with other information ICE records on whether the individual was actually booked into its custody. For example, ICE sometimes records an agency refused its transfer request even though other data indicates ICE actually assumed custody of the individual. In addition, some jurisdictions that adopted restrictive measures curtailing cooperation with ICE's detainer program do not show up in ICE data as actually refusing ICE detainers.
It is thus unclear whether meaningful cooperation has increased, or whether ICE practices have changed in recording when refusals occur.
Even when comparing states there seems to be a serious disconnect between recorded refusals and whether ICE took the subject of the detainer into custody. Examining records state-by- state for the entire FY 2014 - FY 2016 period, the failure to assume custody ranged from a high of 86.9 percent in Indiana down to a low of 29.4 percent in Arizona. Yet both of these states had exactly the same recorded LEA refusal rate — a mere 0.1 percent. See Table 1.
| Number | Per Cent | ||||||
|---|---|---|---|---|---|---|---|
| State | Total I-247s | ICE Takes Custody | No ICE Custody | LEA Refused*** | % ICE Takes Custody | % No ICE Custody | % LEA Refused |
| Total** | 267,548 | 118,947 | 148,601 | 16,305 | 44.5% | 55.5% | 6.1% |
| INDIANA | 1,385 | 181 | 1,204 | 2 | 13.1% | 86.9% | 0.1% |
| MISSOURI | 876 | 118 | 758 | 3 | 13.5% | 86.5% | 0.3% |
| VERMONT | 26 | 4 | 22 | 0 | 15.4% | 84.6% | 0.0% |
| RHODE ISLAND | 137 | 33 | 104 | 13 | 24.1% | 75.9% | 9.5% |
| LOUISIANA | 1,892 | 456 | 1,436 | 20 | 24.1% | 75.9% | 1.1% |
| KANSAS | 1,082 | 263 | 819 | 27 | 24.3% | 75.7% | 2.5% |
| MAINE | 53 | 13 | 40 | 0 | 24.5% | 75.5% | 0.0% |
| ALASKA | 64 | 17 | 47 | 0 | 26.6% | 73.4% | 0.0% |
| IOWA | 1,345 | 370 | 975 | 51 | 27.5% | 72.5% | 3.8% |
| KENTUCKY | 888 | 252 | 636 | 14 | 28.4% | 71.6% | 1.6% |
| TENNESSEE | 3,740 | 1,071 | 2,669 | 10 | 28.6% | 71.4% | 0.3% |
| NEBRASKA | 1,448 | 424 | 1,024 | 21 | 29.3% | 70.7% | 1.5% |
| NEW MEXICO | 1,679 | 501 | 1,178 | 129 | 29.8% | 70.2% | 7.7% |
| OKLAHOMA | 3,559 | 1,104 | 2,455 | 30 | 31.0% | 69.0% | 0.8% |
| ILLINOIS | 4,615 | 1,448 | 3,167 | 456 | 31.4% | 68.6% | 9.9% |
| DELAWARE | 297 | 94 | 203 | 0 | 31.6% | 68.4% | 0.0% |
| NEW HAMPSHIRE | 318 | 103 | 215 | 6 | 32.4% | 67.6% | 1.9% |
| CALIFORNIA | 46,444 | 15,211 | 31,233 | 7,292 | 32.8% | 67.2% | 15.7% |
| NEW YORK | 10,768 | 3,562 | 7,206 | 1,696 | 33.1% | 66.9% | 15.8% |
| ARKANSAS | 1,664 | 553 | 1,111 | 8 | 33.2% | 66.8% | 0.5% |
| SOUTH DAKOTA | 297 | 100 | 197 | 1 | 33.7% | 66.3% | 0.3% |
| PENNSYLVANIA | 5,382 | 2,048 | 3,334 | 171 | 38.1% | 61.9% | 3.2% |
| HAWAII | 213 | 82 | 131 | 0 | 38.5% | 61.5% | 0.0% |
| SOUTH CAROLINA | 3,031 | 1,191 | 1,840 | 5 | 39.3% | 60.7% | 0.2% |
| FLORIDA | 11,462 | 4,605 | 6,857 | 1,022 | 40.2% | 59.8% | 8.9% |
| MINNESOTA | 2,239 | 910 | 1,329 | 158 | 40.6% | 59.4% | 7.1% |
| COLORADO | 5,268 | 2,162 | 3,106 | 804 | 41.0% | 59.0% | 15.3% |
| DISTRICT OF COLUMBIA | 323 | 133 | 190 | 9 | 41.2% | 58.8% | 2.8% |
| MISSISSIPPI | 2,570 | 1,068 | 1,502 | 12 | 41.6% | 58.4% | 0.5% |
| MONTANA | 55 | 23 | 32 | 0 | 41.8% | 58.2% | 0.0% |
| MARYLAND | 2,247 | 959 | 1,288 | 234 | 42.7% | 57.3% | 10.4% |
| IDAHO | 1,381 | 590 | 791 | 1 | 42.7% | 57.3% | 0.1% |
| ALABAMA | 2,529 | 1,096 | 1,433 | 19 | 43.3% | 56.7% | 0.8% |
| NORTH CAROLINA | 6,275 | 2,727 | 3,548 | 20 | 43.5% | 56.5% | 0.3% |
| OHIO | 3,835 | 1,685 | 2,150 | 77 | 43.9% | 56.1% | 2.0% |
| MASSACHUSETTS | 1,232 | 551 | 681 | 12 | 44.7% | 55.3% | 1.0% |
| OREGON | 2,595 | 1,206 | 1,389 | 184 | 46.5% | 53.5% | 7.1% |
| WYOMING | 348 | 169 | 179 | 0 | 48.6% | 51.4% | 0.0% |
| GEORGIA | 11,089 | 5,585 | 5,504 | 37 | 50.4% | 49.6% | 0.3% |
| NEW JERSEY | 3,739 | 1,888 | 1,851 | 38 | 50.5% | 49.5% | 1.0% |
| WASHINGTON | 3,620 | 1,909 | 1,711 | 358 | 52.7% | 47.3% | 9.9% |
| CONNECTICUT | 500 | 264 | 236 | 30 | 52.8% | 47.2% | 6.0% |
| WEST VIRGINIA | 316 | 172 | 144 | 1 | 54.4% | 45.6% | 0.3% |
| MICHIGAN | 1,413 | 775 | 638 | 2 | 54.8% | 45.2% | 0.1% |
| NEVADA | 3,204 | 1,814 | 1,390 | 340 | 56.6% | 43.4% | 10.6% |
| NORTH DAKOTA | 145 | 86 | 59 | 1 | 59.3% | 40.7% | 0.7% |
| UTAH | 2,575 | 1,557 | 1,018 | 3 | 60.5% | 39.5% | 0.1% |
| WISCONSIN | 1,649 | 1,005 | 644 | 17 | 60.9% | 39.1% | 1.0% |
| TEXAS | 58,452 | 35,632 | 22,820 | 18 | 61.0% | 39.0% | 0.0% |
| VIRGINIA | 5,860 | 3,993 | 1,867 | 16 | 68.1% | 31.9% | 0.3% |
| ARIZONA | 16,724 | 11,811 | 4,913 | 13 | 70.6% | 29.4% | 0.1% |
ICE Still Failing to Take Most Detainer Targets into Custody
Since April of 2014 the majority of ICE requests to law enforcement agencies (LEAs) to assume custody of an individual have not been effectuated. That is, examining each I-247 form that ICE prepared, ICE assumed custody less than half of the time. Indeed, during the first two months of FY 2016, ICE did not assume custody of more than six out of every ten individuals against whom detainers were lodged.
These figures are in sharp contrast to ICE's success rate back in FY 2009. Then 70 percent of its detainers resulted in ICE successfully taking the individual into custody. The drop from this 70 percent rate during FY 2009 to below 40 percent so far in FY 2016 is dramatic.[2] While there are potentially many legitimate reasons why ICE might issue an I-247 form but then not take custody of the individual, the magnitude of this decline is startling.
As shown in Table 2 and Figure 2, this decline appears to have begun at a time when ICE was rapidly expanding the number of detainers it issued under Secure Communities. It may be that this rapid expansion exceeded ICE's capacity to actually pick up and detain the individuals on whom it issued detainers. Only after the growth in the number of ICE detainers ended, and indeed detainer numbers began to fall, did the proportion of those ICE took into custody appear to stabilize at around 55 percent.
The second precipitous fall — this time from around 55 percent to below 40 percent — occurred more recently as more and more law enforcement agencies started refusing to honor ICE detainers. However it remains a puzzle — if in fact DHS's outreach efforts have improved LEA cooperation as Secretary Johnson reports — why no corresponding increase has occurred in the occasions where individuals were transferred to ICE custody. Using this latter criteria, Homeland Security's outreach to state and local law enforcement agencies would not appear as yet to have brought about any major impact on ICE's success in taking individuals thought to be deportable into custody.
(click title to open in a new window)
| Number | Per Cent | ||||||
|---|---|---|---|---|---|---|---|
| Year and Month | Total I-247s | ICE Takes Custody | No ICE Custody | LEA Refused* | % ICE Takes Custody | % No ICE Custody | % LEA Refused |
| 2008-10 | 19,349 | 13,895 | 5,454 | 0 | 71.8% | 28.2% | 0.0% |
| 2008-11 | 17,449 | 12,303 | 5,146 | 0 | 70.5% | 29.5% | 0.0% |
| 2008-12 | 17,178 | 12,142 | 5,036 | 2 | 70.7% | 29.3% | 0.0% |
| 2009-01 | 18,313 | 12,972 | 5,341 | 0 | 70.8% | 29.2% | 0.0% |
| 2009-02 | 18,756 | 13,506 | 5,250 | 1 | 72.0% | 28.0% | 0.0% |
| 2009-03 | 21,060 | 15,060 | 6,000 | 1 | 71.5% | 28.5% | 0.0% |
| 2009-04 | 19,955 | 14,100 | 5,855 | 3 | 70.7% | 29.3% | 0.0% |
| 2009-05 | 21,217 | 14,349 | 6,868 | 1 | 67.6% | 32.4% | 0.0% |
| 2009-06 | 22,045 | 15,207 | 6,838 | 2 | 69.0% | 31.0% | 0.0% |
| 2009-07 | 23,302 | 15,886 | 7,416 | 0 | 68.2% | 31.8% | 0.0% |
| 2009-08 | 23,005 | 15,553 | 7,452 | 0 | 67.6% | 32.4% | 0.0% |
| 2009-09 | 22,317 | 15,192 | 7,125 | 4 | 68.1% | 31.9% | 0.0% |
| 2009-10 | 21,621 | 14,365 | 7,256 | 3 | 66.4% | 33.6% | 0.0% |
| 2009-11 | 20,312 | 13,229 | 7,083 | 0 | 65.1% | 34.9% | 0.0% |
| 2009-12 | 20,145 | 12,828 | 7,317 | 2 | 63.7% | 36.3% | 0.0% |
| 2010-01 | 21,934 | 13,774 | 8,160 | 1 | 62.8% | 37.2% | 0.0% |
| 2010-02 | 21,113 | 13,481 | 7,632 | 2 | 63.9% | 36.1% | 0.0% |
| 2010-03 | 25,102 | 16,713 | 8,389 | 5 | 66.6% | 33.4% | 0.0% |
| 2010-04 | 24,892 | 16,328 | 8,564 | 2 | 65.6% | 34.4% | 0.0% |
| 2010-05 | 25,876 | 16,607 | 9,269 | 2 | 64.2% | 35.8% | 0.0% |
| 2010-06 | 25,746 | 16,276 | 9,470 | 2 | 63.2% | 36.8% | 0.0% |
| 2010-07 | 27,612 | 15,137 | 12,475 | 4 | 54.8% | 45.2% | 0.0% |
| 2010-08 | 26,330 | 16,182 | 10,148 | 1 | 61.5% | 38.5% | 0.0% |
| 2010-09 | 24,719 | 15,549 | 9,170 | 3 | 62.9% | 37.1% | 0.0% |
| 2010-10 | 25,026 | 14,996 | 10,030 | 2 | 59.9% | 40.1% | 0.0% |
| 2010-11 | 24,505 | 14,546 | 9,959 | 4 | 59.4% | 40.6% | 0.0% |
| 2010-12 | 23,580 | 13,602 | 9,978 | 1 | 57.7% | 42.3% | 0.0% |
| 2011-01 | 24,820 | 14,159 | 10,661 | 4 | 57.0% | 43.0% | 0.0% |
| 2011-02 | 24,403 | 13,799 | 10,604 | 2 | 56.5% | 43.5% | 0.0% |
| 2011-03 | 27,916 | 15,868 | 12,048 | 5 | 56.8% | 43.2% | 0.0% |
| 2011-04 | 26,269 | 14,752 | 11,517 | 4 | 56.2% | 43.8% | 0.0% |
| 2011-05 | 26,808 | 14,800 | 12,008 | 4 | 55.2% | 44.8% | 0.0% |
| 2011-06 | 26,947 | 14,666 | 12,281 | 1 | 54.4% | 45.6% | 0.0% |
| 2011-07 | 26,460 | 14,463 | 11,997 | 3 | 54.7% | 45.3% | 0.0% |
| 2011-08 | 27,755 | 15,508 | 12,247 | 10 | 55.9% | 44.1% | 0.0% |
| 2011-09 | 25,208 | 13,913 | 11,295 | 7 | 55.2% | 44.8% | 0.0% |
| 2011-10 | 24,856 | 13,796 | 11,060 | 50 | 55.5% | 44.5% | 0.2% |
| 2011-11 | 22,822 | 12,752 | 10,070 | 29 | 55.9% | 44.1% | 0.1% |
| 2011-12 | 21,831 | 11,922 | 9,909 | 36 | 54.6% | 45.4% | 0.2% |
| 2012-01 | 23,646 | 12,781 | 10,865 | 19 | 54.1% | 45.9% | 0.1% |
| 2012-02 | 23,288 | 12,773 | 10,515 | 27 | 54.8% | 45.2% | 0.1% |
| 2012-03 | 23,920 | 13,190 | 10,730 | 54 | 55.1% | 44.9% | 0.2% |
| 2012-04 | 23,652 | 13,424 | 10,228 | 27 | 56.8% | 43.2% | 0.1% |
| 2012-05 | 23,609 | 13,534 | 10,075 | 23 | 57.3% | 42.7% | 0.1% |
| 2012-06 | 22,017 | 12,604 | 9,413 | 39 | 57.2% | 42.8% | 0.2% |
| 2012-07 | 23,186 | 13,427 | 9,759 | 85 | 57.9% | 42.1% | 0.4% |
| 2012-08 | 22,678 | 12,940 | 9,738 | 32 | 57.1% | 42.9% | 0.1% |
| 2012-09 | 20,676 | 11,889 | 8,787 | 23 | 57.5% | 42.5% | 0.1% |
| 2012-10 | 20,972 | 11,803 | 9,169 | 62 | 56.3% | 43.7% | 0.3% |
| 2012-11 | 18,068 | 9,944 | 8,124 | 42 | 55.0% | 45.0% | 0.2% |
| 2012-12 | 16,962 | 9,258 | 7,704 | 45 | 54.6% | 45.4% | 0.3% |
| 2013-01 | 17,120 | 9,437 | 7,683 | 64 | 55.1% | 44.9% | 0.4% |
| 2013-02 | 15,559 | 8,142 | 7,417 | 61 | 52.3% | 47.7% | 0.4% |
| 2013-03 | 17,611 | 9,594 | 8,017 | 71 | 54.5% | 45.5% | 0.4% |
| 2013-04 | 18,066 | 9,660 | 8,406 | 57 | 53.5% | 46.5% | 0.3% |
| 2013-05 | 17,937 | 9,374 | 8,563 | 87 | 52.3% | 47.7% | 0.5% |
| 2013-06 | 16,454 | 8,339 | 8,115 | 84 | 50.7% | 49.3% | 0.5% |
| 2013-07 | 16,985 | 9,286 | 7,699 | 73 | 54.7% | 45.3% | 0.4% |
| 2013-08 | 17,163 | 9,526 | 7,637 | 106 | 55.5% | 44.5% | 0.6% |
| 2013-09 | 16,311 | 9,052 | 7,259 | 110 | 55.5% | 44.5% | 0.7% |
| 2013-10 | 16,581 | 9,400 | 7,181 | 210 | 56.7% | 43.3% | 1.3% |
| 2013-11 | 14,436 | 8,200 | 6,236 | 207 | 56.8% | 43.2% | 1.4% |
| 2013-12 | 13,123 | 7,422 | 5,701 | 232 | 56.6% | 43.4% | 1.8% |
| 2014-01 | 13,307 | 6,904 | 6,403 | 776 | 51.9% | 48.1% | 5.8% |
| 2014-02 | 12,820 | 6,459 | 6,361 | 873 | 50.4% | 49.6% | 6.8% |
| 2014-03 | 13,995 | 7,062 | 6,933 | 976 | 50.5% | 49.5% | 7.0% |
| 2014-04 | 13,121 | 6,201 | 6,920 | 1,037 | 47.3% | 52.7% | 7.9% |
| 2014-05 | 12,714 | 5,936 | 6,778 | 1,127 | 46.7% | 53.3% | 8.9% |
| 2014-06 | 12,324 | 5,417 | 6,907 | 1,282 | 44.0% | 56.0% | 10.4% |
| 2014-07 | 12,589 | 5,176 | 7,413 | 1,304 | 41.1% | 58.9% | 10.4% |
| 2014-08 | 12,681 | 5,101 | 7,580 | 1,250 | 40.2% | 59.8% | 9.9% |
| 2014-09 | 11,519 | 4,748 | 6,771 | 1,167 | 41.2% | 58.8% | 10.1% |
| 2014-10 | 11,201 | 4,423 | 6,778 | 1,054 | 39.5% | 60.5% | 9.4% |
| 2014-11 | 9,452 | 3,499 | 5,953 | 891 | 37.0% | 63.0% | 9.4% |
| 2014-12 | 8,105 | 2,876 | 5,229 | 598 | 35.5% | 64.5% | 7.4% |
| 2015-01 | 7,093 | 2,841 | 4,252 | 450 | 40.1% | 59.9% | 6.3% |
| 2015-02 | 6,975 | 2,829 | 4,146 | 413 | 40.6% | 59.4% | 5.9% |
| 2015-03 | 7,954 | 3,231 | 4,723 | 431 | 40.6% | 59.4% | 5.4% |
| 2015-04 | 8,001 | 3,170 | 4,831 | 411 | 39.6% | 60.4% | 5.1% |
| 2015-05 | 7,559 | 2,912 | 4,647 | 341 | 38.5% | 61.5% | 4.5% |
| 2015-06 | 7,487 | 2,812 | 4,675 | 352 | 37.6% | 62.4% | 4.7% |
| 2015-07 | 7,017 | 2,502 | 4,515 | 331 | 35.7% | 64.3% | 4.7% |
| 2015-08 | 7,444 | 2,767 | 4,677 | 191 | 37.2% | 62.8% | 2.6% |
| 2015-09 | 6,797 | 2,438 | 4,359 | 154 | 35.9% | 64.1% | 2.3% |
| 2015-10 | 7,107 | 2,549 | 4,558 | 150 | 35.9% | 64.1% | 2.1% |
| 2015-11 | 6,146 | 2,072 | 4,074 | 97 | 33.7% | 66.3% | 1.6% |
Details Now Available for Individual State and Local Law Enforcement Agencies
TRAC has just released a new free detainer app that allows users to examine the details month-by-month on ICE I-247 forms sent to each individual state and local law enforcement agency during FY 2003 to FY 2016. Available are ICE records on whether the detainer request was refused, as well as whether ICE successfully took the individual sought into custody. Users can drill in to analyze what happened to detainers depending upon whether the individual had ever been convicted of any crime, as well as drill further down to the specific criminal offense - drunk driving versus homicide, for example. Demographic information by age, citizenship, and gender can also be examined.
The data show that while Texas leads the country in receiving the largest number of ICE I-247s since FY 2014, California law enforcement agencies have racked up the largest number of recorded refusals of ICE detainers. That state also had the largest number of occasions in which ICE fails to assume custody of an individual after it issued an I-247.
Table 3 presents some highlights from this wealth of data. If the proportion of detainer requests that state and local LEAs refused to honor is examined during the months immediately prior to the ending of Secure Communities, California LEAs not surprisingly held each of the top spots. The Santa Clara County Main Jail had the highest recorded refusal rate in the nation at 88.2 percent. However, in the latest available data since Secretary Johnson's reforms were implemented (July - November 2015), the recorded refusal rate has plummeted to 4.8 percent. Yet ICE still failed to assume custody of virtually every individual on whom it sent an I-247 form to the Santa Clara authorities both before and after the outreach effort by DHS occurred. This raises the question: Did Santa Clara's cooperation actually increase? Or did ICE simply stop recording refusals that occurred? Or is there some other explanation for these wildly dissimilar trends?
A similar divergent picture emerges, depending upon the measure of cooperation, for the LEAs who had the second and third highest recorded refusal rates in the months immediately prior to DHS's outreach efforts. The Santa Rita Jail in Alameda County, California, was second with an 80.1 percent recorded refusal rate, while the San Mateo County Jail in California had 74.1 percent. Each of these saw their recorded refusal rates plummet to 0.9 percent and 2.4 percent, respectively, in the most recent ICE records. Yet ICE still failed to take into custody the vast majority of individuals held in these jails during this same period on whom I-247s were issued.
However, recorded LEA refusal rates did not always plummet between June 2014 and November 2015. The fourth highest recorded refusal rate in the nation of 68.7 before PEP was announced was by the Ventura County Jail in California. After the reforms, ICE recorded that the refusal rate declined. However, this facility still refused half of all I-247s it received. ICE data also showed a parallel increase in the rate individuals held in Ventura County Jail were taken into ICE custody — from 0.4 percent before the reforms to 12.5 percent after they occurred.
Beyond California, three other law enforcement agencies were among the top ten recording the highest refusal rates before PEP was announced. These were the Philadelphia Detention facility in Pennsylvania (sixth place), the King County Adult Jail in Washington State (eighth place), and the Cook County Jail in Illinois (tenth place) — all facilities located in major metropolitan areas in the nation. King County and Cook County facilities refusal rates each plummeted in the latest ICE data, while ICE failed to show any increase in the proportion of individuals with I-247s taken into custody. The Philadelphia Detention facility, in contrast, showed only a modest drop in recorded refusal rates (from 67.3 to 50.0 percent) and a similar small increase in those ICE took into custody (from 14.5 to 25 percent).
Similar data for additional facilities can be found below in Table 3. Information for other specific time periods can be found in TRAC's new free detainer app.
(click title to open in a new window)
| Before PEP (June-Oct 2014) | PEP (July-Nov2015) | Before PEP vs. After PEP | |||||||||
|---|---|---|---|---|---|---|---|---|---|---|---|
| State | County and Law Enforcement Facility* | Total I-247s | No ICE Custody | LEA Refused** | Total I-247s | No ICE Custody | LEA Refused | % No ICE Custody | % LEA Refused | ||
| Before | After | Before | After | ||||||||
| Total | 60,314 | 35,449 | 6,057 | 34,511 | 22,183 | 923 | 58.8% | 64.3% | 10.0% | 2.7% | |
| CALIFORNIA | Santa Clara County - Santa Clara County Main Jail | 229 | 229 | 202 | 147 | 146 | 7 | 100.0% | 99.3% | 88.2% | 4.8% |
| CALIFORNIA | Alameda County - Santa Rita Jail | 296 | 295 | 237 | 113 | 85 | 1 | 99.7% | 75.2% | 80.1% | 0.9% |
| CALIFORNIA | San Mateo County - San Mateo Co Jail | 139 | 139 | 103 | 85 | 83 | 2 | 100.0% | 97.6% | 74.1% | 2.4% |
| CALIFORNIA | Ventura County - Ventura County Jail | 249 | 248 | 171 | 281 | 246 | 144 | 99.6% | 87.5% | 68.7% | 51.2% |
| CALIFORNIA | Santa Barbara County - Santa Barbara County Jail | 228 | 227 | 156 | 227 | 180 | 38 | 99.6% | 79.3% | 68.4% | 16.7% |
| PENNSYLVANIA | Philadelphia County - Philadelphia Detention Ct | 55 | 47 | 37 | 8 | 6 | 4 | 85.5% | 75.0% | 67.3% | 50.0% |
| CALIFORNIA | Santa Clara County - Santa Clara County Jail | 66 | 66 | 43 | 45 | 44 | 1 | 100.0% | 97.8% | 65.2% | 2.2% |
| WASHINGTON | King County - King County Adult Jail | 83 | 73 | 53 | 27 | 24 | 1 | 88.0% | 88.9% | 63.9% | 3.7% |
| CALIFORNIA | Contra Costa County - Contra Costa County Jail | 204 | 203 | 127 | 131 | 111 | 5 | 99.5% | 84.7% | 62.3% | 3.8% |
| ILLINOIS | Cook County - Cook County Jail | 307 | 297 | 190 | 41 | 40 | 8 | 96.7% | 97.6% | 61.9% | 19.5% |
| CALIFORNIA | San Francisco County - San Francisco Co Jail | 131 | 131 | 81 | 88 | 88 | 6 | 100.0% | 100.0% | 61.8% | 6.8% |
| COLORADO | Denver County - Denver Justice Center | 268 | 194 | 165 | 122 | 53 | 20 | 72.4% | 43.4% | 61.6% | 16.4% |
| FLORIDA | Miami-Dade County - Dade County Correctional | 302 | 284 | 183 | 61 | 59 | 33 | 94.0% | 96.7% | 60.6% | 54.1% |
| FLORIDA | Miami-Dade County - Turner Guiford Knight (Tgk) Jail | 114 | 110 | 65 | 52 | 51 | 19 | 96.5% | 98.1% | 57.0% | 36.5% |
| CALIFORNIA | Sonoma County - Sonoma Co Main Adult Det | 135 | 135 | 64 | 87 | 82 | 0 | 100.0% | 94.3% | 47.4% | 0.0% |
| CALIFORNIA | Fresno County - Fresno County Jail | 225 | 193 | 103 | 109 | 86 | 0 | 85.8% | 78.9% | 45.8% | 0.0% |
| NEVADA | Clark County - Clark County Det.Center | 296 | 208 | 131 | 172 | 90 | 21 | 70.3% | 52.3% | 44.3% | 12.2% |
| COLORADO | Unknown county - Arapahoe County Jail | 53 | 40 | 23 | 39 | 25 | 6 | 75.5% | 64.1% | 43.4% | 15.4% |
| CALIFORNIA | San Joaquin County - San Joaquin County Jail | 123 | 123 | 53 | 93 | 92 | 9 | 100.0% | 98.9% | 43.1% | 9.7% |
| COLORADO | Weld County - Weld County Jail | 65 | 54 | 28 | 34 | 26 | 14 | 83.1% | 76.5% | 43.1% | 41.2% |
| NEW YORK | Unknown county - Rikers Island, Queens, Ny | 594 | 454 | 254 | 64 | 62 | 8 | 76.4% | 96.9% | 42.8% | 12.5% |
| COLORADO | Jefferson County - Jefferson County Jail | 66 | 47 | 28 | 33 | 22 | 3 | 71.2% | 66.7% | 42.4% | 9.1% |
| NEW YORK | Queens County - Queens Central Booking | 336 | 212 | 136 | 22 | 22 | 7 | 63.1% | 100.0% | 40.5% | 31.8% |
| NEW YORK | Bronx County - Bronx Central Booking | 149 | 106 | 59 | 19 | 18 | 2 | 71.1% | 94.7% | 39.6% | 10.5% |
| FLORIDA | Broward County - Broward County Jail | 148 | 128 | 58 | 38 | 35 | 3 | 86.5% | 92.1% | 39.2% | 7.9% |
| CALIFORNIA | Sacramento County - Sacramento County Jail | 168 | 122 | 64 | 64 | 55 | 9 | 72.6% | 85.9% | 38.1% | 14.1% |
| NEW YORK | Kings County - Brooklyn Central Booking | 237 | 157 | 90 | 17 | 17 | 3 | 66.2% | 100.0% | 38.0% | 17.6% |
| CALIFORNIA | Marin County - Marin Co. Jail | 52 | 50 | 19 | 42 | 37 | 3 | 96.2% | 88.1% | 36.5% | 7.1% |
| OREGON | Washington County - Washington County Jail | 59 | 30 | 20 | 21 | 14 | 3 | 50.8% | 66.7% | 33.9% | 14.3% |
| MARYLAND | Prince George's County - Prince Georges Co Det Cen | 116 | 71 | 37 | 20 | 13 | 7 | 61.2% | 65.0% | 31.9% | 35.0% |
| MINNESOTA | Hennepin County - Hennepin County Adc | 123 | 93 | 39 | 70 | 60 | 8 | 75.6% | 85.7% | 31.7% | 11.4% |
| CALIFORNIA | Riverside County - Riverside County Sheriff | 195 | 187 | 57 | 126 | 126 | 1 | 95.9% | 100.0% | 29.2% | 0.8% |
| NEW YORK | New York County - Manhattan Central Booking | 173 | 107 | 49 | 24 | 24 | 3 | 61.8% | 100.0% | 28.3% | 12.5% |
| MARYLAND | Baltimore County - Baltimore County Det. Center | 60 | 27 | 16 | 15 | 9 | 2 | 45.0% | 60.0% | 26.7% | 13.3% |
| CALIFORNIA | Los Angeles County - Los Angeles County Jail | 1,492 | 925 | 377 | 530 | 350 | 4 | 62.0% | 66.0% | 25.3% | 0.8% |
| CALIFORNIA | Los Angeles County - Los Custody Case Holding Facility | 84 | 38 | 21 | 8 | 0 | 0 | 45.2% | 0.0% | 25.0% | 0.0% |
| CALIFORNIA | San Diego County - Vista Detention Facility | 395 | 162 | 96 | 114 | 17 | 0 | 41.0% | 14.9% | 24.3% | 0.0% |
| CALIFORNIA | Merced County - Merced County Jail | 70 | 65 | 17 | 25 | 24 | 0 | 92.9% | 96.0% | 24.3% | 0.0% |
| COLORADO | Adams County - Adams County Jail | 168 | 62 | 40 | 102 | 38 | 5 | 36.9% | 37.3% | 23.8% | 4.9% |
| CALIFORNIA | Monterey County - Monterey Co. Jail | 177 | 174 | 42 | 260 | 124 | 2 | 98.3% | 47.7% | 23.7% | 0.8% |
| FLORIDA | Pinellas County - Pinellas County Jail | 72 | 53 | 17 | 10 | 10 | 0 | 73.6% | 100.0% | 23.6% | 0.0% |
| CALIFORNIA | San Bernardino County - San Bernardino County Jail | 218 | 216 | 48 | 143 | 127 | 1 | 99.1% | 88.8% | 22.0% | 0.7% |
| CALIFORNIA | San Diego County - San Diego County Jail | 342 | 161 | 73 | 140 | 42 | 1 | 47.1% | 30.0% | 21.3% | 0.7% |
| CALIFORNIA | Kern County - Kern County Jail | 220 | 163 | 39 | 131 | 117 | 6 | 74.1% | 89.3% | 17.7% | 4.6% |
| CALIFORNIA | Tulare County - Tulare County Jail | 200 | 167 | 33 | 100 | 94 | 2 | 83.5% | 94.0% | 16.5% | 2.0% |
| OREGON | Multnomah County - Multnomah County Jail | 51 | 39 | 8 | 10 | 6 | 1 | 76.5% | 60.0% | 15.7% | 10.0% |
| MARYLAND | Montgomery County - Montgomery County Det. | 129 | 50 | 16 | 73 | 62 | 15 | 38.8% | 84.9% | 12.4% | 20.5% |
| CALIFORNIA | Los Angeles County - Los Angeles Police Pd 77th Div. | 81 | 76 | 10 | 45 | 41 | 0 | 93.8% | 91.1% | 12.3% | 0.0% |
| FLORIDA | Palm Beach County - Palm Beach County Jail | 137 | 92 | 15 | 44 | 40 | 1 | 67.2% | 90.9% | 10.9% | 2.3% |
| CALIFORNIA | Santa Cruz County - Santa Cruz Co Main Jail | 58 | 50 | 6 | 29 | 27 | 1 | 86.2% | 93.1% | 10.3% | 3.4% |
| NEW MEXICO | Bernalillo County - Metropolitan Detention Center | 52 | 42 | 5 | 9 | 5 | 0 | 80.8% | 55.6% | 9.6% | 0.0% |
| OHIO | Franklin County - Franklin County Jail | 263 | 190 | 21 | 34 | 31 | 3 | 72.2% | 91.2% | 8.0% | 8.8% |
| MISSISSIPPI | Yazoo County - Yazoo City Medium Fci | 57 | 28 | 4 | 46 | 11 | 0 | 49.1% | 23.9% | 7.0% | 0.0% |
| DISTRICT OF COLUMBIA | District of Columbia - DC Department of Corrections | 100 | 58 | 7 | 24 | 19 | 0 | 58.0% | 79.2% | 7.0% | 0.0% |
| NEW YORK | Suffolk County - Suffolk Co.Correc Fac | 250 | 139 | 17 | 99 | 61 | 6 | 55.6% | 61.6% | 6.8% | 6.1% |
| LOUISIANA | Grant Parish - Pollock F.C.I. | 78 | 51 | 5 | 52 | 43 | 1 | 65.4% | 82.7% | 6.4% | 1.9% |
| CALIFORNIA | Los Angeles County - Long Beach City Jail | 63 | 49 | 4 | 26 | 24 | 1 | 77.8% | 92.3% | 6.3% | 3.8% |
| FLORIDA | Okaloosa County - Okaloosa County D.O.C. | 80 | 56 | 5 | 15 | 8 | 0 | 70.0% | 53.3% | 6.3% | 0.0% |
| CALIFORNIA | Los Angeles County - Los Angeles City Jail | 664 | 606 | 40 | 300 | 272 | 3 | 91.3% | 90.7% | 6.0% | 1.0% |
| FLORIDA | Polk County - Polk County Jail | 50 | 31 | 3 | 15 | 6 | 0 | 62.0% | 40.0% | 6.0% | 0.0% |
| CALIFORNIA | Madera County - Madera Co Dept Of Correct | 72 | 41 | 4 | 25 | 21 | 0 | 56.9% | 84.0% | 5.6% | 0.0% |
| NEBRASKA | Douglas County - Douglas County Correction Facility | 72 | 50 | 4 | 19 | 16 | 0 | 69.4% | 84.2% | 5.6% | 0.0% |
| FLORIDA | Hillsborough County - Hillsborough County Jail | 198 | 124 | 9 | 73 | 43 | 1 | 62.6% | 58.9% | 4.5% | 1.4% |
| FLORIDA | Orange County - Orange County Jail | 194 | 143 | 7 | 90 | 66 | 1 | 73.7% | 73.3% | 3.6% | 1.1% |
| CALIFORNIA | Orange County - Orange County Jail | 595 | 506 | 21 | 450 | 296 | 12 | 85.0% | 65.8% | 3.5% | 2.7% |
| NEW YORK | Westchester County - Westchester Co.Jail,valha | 86 | 36 | 3 | 30 | 19 | 1 | 41.9% | 63.3% | 3.5% | 3.3% |
| NEVADA | Clark County - Las Vegas City Jail | 118 | 31 | 4 | 178 | 43 | 0 | 26.3% | 24.2% | 3.4% | 0.0% |
| ALABAMA | Pickens County - Aliceville Fci | 62 | 21 | 1 | 119 | 22 | 0 | 33.9% | 18.5% | 1.6% | 0.0% |
| FLORIDA | Lee County - Lee County Jail | 71 | 59 | 1 | 76 | 65 | 0 | 83.1% | 85.5% | 1.4% | 0.0% |
| NEVADA | Clark County - City Of Las Vegas Det.Center | 71 | 11 | 1 | 1 | 0 | 0 | 15.5% | 0.0% | 1.4% | 0.0% |
| NEW JERSEY | Middlesex County - Middlesex County Jail | 71 | 31 | 1 | 34 | 26 | 0 | 43.7% | 76.5% | 1.4% | 0.0% |
| SOUTH CAROLINA | Beaufort County - Beaufort County Det Center | 89 | 76 | 1 | 32 | 25 | 0 | 85.4% | 78.1% | 1.1% | 0.0% |
| GEORGIA | Charlton County - D. Ray James Prison | 213 | 56 | 2 | 176 | 142 | 0 | 26.3% | 80.7% | 0.9% | 0.0% |
| FLORIDA | Duval County - Duval/Jacksonville Jail | 107 | 22 | 1 | 47 | 16 | 0 | 20.6% | 34.0% | 0.9% | 0.0% |
| CALIFORNIA | Kern County - Ccf-Delano | 115 | 111 | 1 | 96 | 94 | 0 | 96.5% | 97.9% | 0.9% | 0.0% |
| NORTH CAROLINA | Wake County - N.C. Dept Of Corrections | 116 | 69 | 1 | 69 | 51 | 0 | 59.5% | 73.9% | 0.9% | 0.0% |
| ILLINOIS | DuPage County - Dupage County Jail | 128 | 54 | 1 | 61 | 31 | 0 | 42.2% | 50.8% | 0.8% | 0.0% |
| FLORIDA | Collier County - Collier County Sheriff Facility | 280 | 66 | 2 | 111 | 25 | 0 | 23.6% | 22.5% | 0.7% | 0.0% |
| SOUTH CAROLINA | Charleston County - Charleston County Correctional Facility | 160 | 113 | 1 | 37 | 12 | 0 | 70.6% | 32.4% | 0.6% | 0.0% |
| GEORGIA | DeKalb County - Dekalb County Jail | 191 | 72 | 1 | 33 | 19 | 0 | 37.7% | 57.6% | 0.5% | 0.0% |
| NEW YORK | Nassau County - Nassau County Correctional Center | 212 | 104 | 1 | 84 | 48 | 1 | 49.1% | 57.1% | 0.5% | 1.2% |
| NORTH CAROLINA | Mecklenburg County - Mecklenburg County Jail Central | 232 | 110 | 1 | 154 | 94 | 1 | 47.4% | 61.0% | 0.4% | 0.6% |
| VIRGINIA | Fairfax City - Fairfax County Jail | 233 | 52 | 1 | 73 | 38 | 0 | 22.3% | 52.1% | 0.4% | 0.0% |
| ILLINOIS | Will County - Stateville Corrections | 250 | 146 | 1 | 185 | 142 | 0 | 58.4% | 76.8% | 0.4% | 0.0% |
| ARIZONA | Pima County - Pima County Jail | 261 | 78 | 1 | 120 | 54 | 1 | 29.9% | 45.0% | 0.4% | 0.8% |
| UTAH | Salt Lake County - Salt Lake County Jail | 282 | 65 | 1 | 152 | 76 | 0 | 23.0% | 50.0% | 0.4% | 0.0% |
| CALIFORNIA | Kern County - Taft Fed.Corr.Inst. | 327 | 146 | 1 | 242 | 194 | 0 | 44.6% | 80.2% | 0.3% | 0.0% |
| OKLAHOMA | Oklahoma County - Oklahoma County Jail | 328 | 325 | 1 | 62 | 61 | 0 | 99.1% | 98.4% | 0.3% | 0.0% |
| VIRGINIA | Manassas City - Prince William Facility | 398 | 106 | 1 | 174 | 50 | 0 | 26.6% | 28.7% | 0.3% | 0.0% |
| GEORGIA | Gwinnett County - Gwinnett County Jail | 627 | 152 | 1 | 247 | 86 | 0 | 24.2% | 34.8% | 0.2% | 0.0% |
| ARIZONA | Maricopa County - Aspc Alhambra | 739 | 277 | 0 | 689 | 568 | 1 | 37.5% | 82.4% | 0.0% | 0.1% |
| ARIZONA | Maricopa County - Maricopa Co Lower Buckeye Jail | 82 | 12 | 0 | 72 | 12 | 0 | 14.6% | 16.7% | 0.0% | 0.0% |
| ARIZONA | Maricopa County - Maricopa County Jail | 1,479 | 137 | 0 | 503 | 116 | 1 | 9.3% | 23.1% | 0.0% | 0.2% |
| ARIZONA | Maricopa County - Us Marshal - Phoenix | 312 | 72 | 0 | 279 | 143 | 0 | 23.1% | 51.3% | 0.0% | 0.0% |
| ARIZONA | Navajo County - Navajo County Sheriff | 55 | 11 | 0 | 10 | 1 | 0 | 20.0% | 10.0% | 0.0% | 0.0% |
| ARIZONA | Pima County - Us Marshal - Tucson | 85 | 30 | 0 | 59 | 36 | 0 | 35.3% | 61.0% | 0.0% | 0.0% |
| ARIZONA | Pinal County - Pinal County Jail | 70 | 36 | 0 | 49 | 35 | 1 | 51.4% | 71.4% | 0.0% | 2.0% |
| ARIZONA | Santa Cruz County - Santa Cruz Co Jail Az | 102 | 78 | 0 | 8 | 5 | 0 | 76.5% | 62.5% | 0.0% | 0.0% |
| ARKANSAS | Washington County - Washington County Jail | 59 | 46 | 0 | 46 | 25 | 0 | 78.0% | 54.3% | 0.0% | 0.0% |
| CALIFORNIA | Imperial County - Calipatria State Prison | 204 | 141 | 0 | 43 | 23 | 0 | 69.1% | 53.5% | 0.0% | 0.0% |
| CALIFORNIA | Kern County - Wasco State Prison | 149 | 127 | 0 | 220 | 196 | 0 | 85.2% | 89.1% | 0.0% | 0.0% |
| CALIFORNIA | Orange County - Anaheim City Jail | 74 | 67 | 0 | 43 | 42 | 2 | 90.5% | 97.7% | 0.0% | 4.7% |
| CALIFORNIA | San Bernardino County - Fci Victorville | 66 | 41 | 0 | 199 | 120 | 0 | 62.1% | 60.3% | 0.0% | 0.0% |
| CALIFORNIA | San Luis Obispo County - Calif. Men Colony, East | 79 | 71 | 0 | 30 | 28 | 0 | 89.9% | 93.3% | 0.0% | 0.0% |
| CALIFORNIA | Santa Barbara County - Lompoc U.S. Prison | 115 | 18 | 0 | 101 | 37 | 0 | 15.7% | 36.6% | 0.0% | 0.0% |
| CALIFORNIA | Stanislaus County - Stanislaus County Jail | 88 | 88 | 0 | 48 | 47 | 0 | 100.0% | 97.9% | 0.0% | 0.0% |
| COLORADO | El Paso County - Colo Dept Of Corrections | 181 | 150 | 0 | 110 | 98 | 0 | 82.9% | 89.1% | 0.0% | 0.0% |
| COLORADO | El Paso County - El Paso County Jail | 77 | 25 | 0 | 38 | 30 | 3 | 32.5% | 78.9% | 0.0% | 7.9% |
| FLORIDA | Leon County - Fl Dept Of Corrections | 134 | 87 | 0 | 110 | 87 | 0 | 64.9% | 79.1% | 0.0% | 0.0% |
| FLORIDA | Martin County - Martin County Jail | 83 | 26 | 0 | 11 | 10 | 0 | 31.3% | 90.9% | 0.0% | 0.0% |
| FLORIDA | Miami-Dade County - South Florida Recept Cent | 73 | 52 | 0 | 52 | 46 | 0 | 71.2% | 88.5% | 0.0% | 0.0% |
| FLORIDA | Sumter County - Coleman Fci | 78 | 38 | 0 | 42 | 26 | 0 | 48.7% | 61.9% | 0.0% | 0.0% |
| GEORGIA | Cherokee County - Cherokee Co Jail Ga | 67 | 28 | 0 | 19 | 6 | 0 | 41.8% | 31.6% | 0.0% | 0.0% |
| GEORGIA | Clayton County - Clayton County Jail | 126 | 60 | 0 | 39 | 34 | 0 | 47.6% | 87.2% | 0.0% | 0.0% |
| GEORGIA | Cobb County - Cobb County Jail | 193 | 91 | 0 | 81 | 18 | 0 | 47.2% | 22.2% | 0.0% | 0.0% |
| GEORGIA | Fulton County - Fulton County Jail | 83 | 42 | 0 | 30 | 18 | 0 | 50.6% | 60.0% | 0.0% | 0.0% |
| GEORGIA | Fulton County - Georgia Dept Of Correctio | 128 | 78 | 0 | 77 | 63 | 0 | 60.9% | 81.8% | 0.0% | 0.0% |
| GEORGIA | Hall County - Hall County Jail | 115 | 28 | 0 | 56 | 24 | 0 | 24.3% | 42.9% | 0.0% | 0.0% |
| GEORGIA | Whitfield County - Whitfield County Jail | 53 | 38 | 0 | 18 | 13 | 0 | 71.7% | 72.2% | 0.0% | 0.0% |
| IDAHO | Cassia County - Minicassia Detention Center | 61 | 32 | 0 | 15 | 6 | 0 | 52.5% | 40.0% | 0.0% | 0.0% |
| INDIANA | Bartholomew County - Bartholomew County Sheriff/Jail | 53 | 53 | 0 | 7 | 7 | 0 | 100.0% | 100.0% | 0.0% | 0.0% |
| LOUISIANA | Jefferson Parish - Jefferson Parish Cor. Center | 50 | 49 | 0 | 25 | 16 | 0 | 98.0% | 64.0% | 0.0% | 0.0% |
| MICHIGAN | Oakland County - Oakland Co., Pontiac, Mi | 50 | 12 | 0 | 13 | 7 | 0 | 24.0% | 53.8% | 0.0% | 0.0% |
| MISSISSIPPI | Adams County - Adams County Det Center | 153 | 57 | 0 | 176 | 38 | 0 | 37.3% | 21.6% | 0.0% | 0.0% |
| MISSISSIPPI | Forrest County - Forrest County A.D.C. | 60 | 37 | 0 | 18 | 10 | 0 | 61.7% | 55.6% | 0.0% | 0.0% |
| MISSISSIPPI | Harrison County - Harrison Detention Center | 90 | 57 | 0 | 30 | 19 | 0 | 63.3% | 63.3% | 0.0% | 0.0% |
| NEW JERSEY | Bergen County - Bergen County Jail | 95 | 41 | 0 | 38 | 13 | 0 | 43.2% | 34.2% | 0.0% | 0.0% |
| NEW JERSEY | Hudson County - Hudson County Correctional Facility (Jail) | 159 | 74 | 0 | 133 | 83 | 0 | 46.5% | 62.4% | 0.0% | 0.0% |
| NEW JERSEY | Monmouth County - Monmouth County Correctional Institution (Jail) | 88 | 30 | 0 | 24 | 14 | 1 | 34.1% | 58.3% | 0.0% | 4.2% |
| NEW JERSEY | Passaic County - Passaic County Jail | 103 | 27 | 0 | 50 | 31 | 0 | 26.2% | 62.0% | 0.0% | 0.0% |
| NEW MEXICO | Cibola County - Cibola County Det Ctr | 52 | 24 | 0 | 43 | 35 | 0 | 46.2% | 81.4% | 0.0% | 0.0% |
| NEW YORK | Dutchess County - Downstate Cf, Fishkill | 64 | 53 | 0 | 49 | 47 | 0 | 82.8% | 95.9% | 0.0% | 0.0% |
| NEW YORK | Ulster County - Ulster Cf, Napanoch | 60 | 40 | 0 | 51 | 40 | 0 | 66.7% | 78.4% | 0.0% | 0.0% |
| NORTH CAROLINA | Durham County - Durham County Det. Center | 56 | 46 | 0 | 20 | 13 | 0 | 82.1% | 65.0% | 0.0% | 0.0% |
| NORTH CAROLINA | Forsyth County - Forsyth County Jail | 57 | 53 | 0 | 18 | 18 | 0 | 93.0% | 100.0% | 0.0% | 0.0% |
| NORTH CAROLINA | Hertford County - Rivers Correctional Institution | 114 | 24 | 0 | 178 | 61 | 0 | 21.1% | 34.3% | 0.0% | 0.0% |
| NORTH CAROLINA | Union County - Union County Jail | 55 | 35 | 0 | 4 | 1 | 0 | 63.6% | 25.0% | 0.0% | 0.0% |
| NORTH CAROLINA | Wake County - Wake County Sheriff Dept. | 320 | 190 | 0 | 122 | 50 | 1 | 59.4% | 41.0% | 0.0% | 0.8% |
| OHIO | Butler County - Butler County Correctional Complex (Jail) | 57 | 21 | 0 | 33 | 12 | 0 | 36.8% | 36.4% | 0.0% | 0.0% |
| OHIO | Hamilton County - Hamilton County Jail | 93 | 48 | 0 | 28 | 13 | 0 | 51.6% | 46.4% | 0.0% | 0.0% |
| OHIO | Mahoning County - Northeast Ohio Corr. Fac. | 107 | 14 | 0 | 1 | 1 | 0 | 13.1% | 100.0% | 0.0% | 0.0% |
| OKLAHOMA | Tulsa County - David L. Moss Criminal Justice Center (Jail) | 321 | 57 | 0 | 144 | 39 | 0 | 17.8% | 27.1% | 0.0% | 0.0% |
| PENNSYLVANIA | Centre County - Moshannon Valley Correctional | 364 | 223 | 0 | 302 | 202 | 0 | 61.3% | 66.9% | 0.0% | 0.0% |
| PENNSYLVANIA | Chester County - Chester Cnty Jail, Pa | 55 | 16 | 0 | 24 | 11 | 0 | 29.1% | 45.8% | 0.0% | 0.0% |
| PENNSYLVANIA | Cumberland County - Camphill Sci, Pa | 57 | 46 | 0 | 64 | 59 | 0 | 80.7% | 92.2% | 0.0% | 0.0% |
| SOUTH CAROLINA | Greenville County - Greenville County Det Center | 110 | 84 | 0 | 36 | 25 | 0 | 76.4% | 69.4% | 0.0% | 0.0% |
| SOUTH CAROLINA | Horry County - Horry County-J Ruben Long Det Cen | 85 | 54 | 0 | 21 | 7 | 0 | 63.5% | 33.3% | 0.0% | 0.0% |
| TENNESSEE | Davidson County - Davidson County Sheriff Facility | 145 | 112 | 0 | 98 | 84 | 0 | 77.2% | 85.7% | 0.0% | 0.0% |
| TENNESSEE | Hamblen County - Hamblen County Jail | 64 | 34 | 0 | 21 | 8 | 0 | 53.1% | 38.1% | 0.0% | 0.0% |
| TENNESSEE | Hamilton County - Hamilton Co. Jail (Tenn) | 74 | 47 | 0 | 26 | 16 | 0 | 63.5% | 61.5% | 0.0% | 0.0% |
| TENNESSEE | Rutherford County - Rutherford County Sheriff | 56 | 51 | 0 | 31 | 21 | 0 | 91.1% | 67.7% | 0.0% | 0.0% |
| TENNESSEE | Shelby County - Shelby Co. Sheriff Office | 81 | 73 | 0 | 43 | 39 | 1 | 90.1% | 90.7% | 0.0% | 2.3% |
| TEXAS | Anderson County - Gurney Transfer Facility | 68 | 43 | 0 | 115 | 94 | 0 | 63.2% | 81.7% | 0.0% | 0.0% |
| TEXAS | Bastrop County - Bastrop County Jail | 70 | 32 | 0 | 23 | 10 | 1 | 45.7% | 43.5% | 0.0% | 4.3% |
| TEXAS | Bee County - Garza West Transfer Facility | 129 | 83 | 0 | 184 | 157 | 0 | 64.3% | 85.3% | 0.0% | 0.0% |
| TEXAS | Bell County - Bell County Jail | 60 | 43 | 0 | 31 | 17 | 0 | 71.7% | 54.8% | 0.0% | 0.0% |
| TEXAS | Bexar County - Bexar County Jail | 312 | 172 | 0 | 82 | 35 | 1 | 55.1% | 42.7% | 0.0% | 1.2% |
| TEXAS | Bexar County - San Antonio (City Of) Magistrate | 273 | 47 | 0 | 83 | 21 | 0 | 17.2% | 25.3% | 0.0% | 0.0% |
| TEXAS | Bexar County - Us Marshals,west.Dist.,tx | 132 | 24 | 0 | 59 | 39 | 0 | 18.2% | 66.1% | 0.0% | 0.0% |
| TEXAS | Brazos County - Brazos County Jail | 61 | 13 | 0 | 27 | 21 | 0 | 21.3% | 77.8% | 0.0% | 0.0% |
| TEXAS | Cameron County - Brownsville Police Dept. | 126 | 18 | 0 | 100 | 20 | 0 | 14.3% | 20.0% | 0.0% | 0.0% |
| TEXAS | Cameron County - Candadian County, El Reno | 122 | 33 | 0 | 104 | 30 | 0 | 27.0% | 28.8% | 0.0% | 0.0% |
| TEXAS | Cameron County - Us Marshals Sdtx | 56 | 55 | 0 | 1 | 0 | 0 | 98.2% | 0.0% | 0.0% | 0.0% |
| TEXAS | Collin County - Collin County Jail | 76 | 33 | 0 | 93 | 43 | 0 | 43.4% | 46.2% | 0.0% | 0.0% |
| TEXAS | Concho County - Ci Eden | 414 | 79 | 0 | 397 | 189 | 0 | 19.1% | 47.6% | 0.0% | 0.0% |
| TEXAS | Dallas County - Dallas County Jail | 941 | 241 | 0 | 513 | 195 | 0 | 25.6% | 38.0% | 0.0% | 0.0% |
| TEXAS | Dallas County - Irving Police Dept. | 96 | 21 | 0 | 33 | 12 | 0 | 21.9% | 36.4% | 0.0% | 0.0% |
| TEXAS | Denton County - Carrollton Police Dept. | 110 | 15 | 0 | 36 | 10 | 0 | 13.6% | 27.8% | 0.0% | 0.0% |
| TEXAS | Fort Bend County - Ft. Bend County Jail | 288 | 219 | 0 | 175 | 133 | 0 | 76.0% | 76.0% | 0.0% | 0.0% |
| TEXAS | Galveston County - Galveston County Sheriff | 50 | 22 | 0 | 18 | 14 | 0 | 44.0% | 77.8% | 0.0% | 0.0% |
| TEXAS | Garza County - Bscc Giles Darby Facility | 152 | 28 | 0 | 240 | 126 | 0 | 18.4% | 52.5% | 0.0% | 0.0% |
| TEXAS | Garza County - Dalby Correctional Institute | 54 | 10 | 0 | 58 | 22 | 0 | 18.5% | 37.9% | 0.0% | 0.0% |
| TEXAS | Harris County - Harris County Jail | 1,516 | 254 | 0 | 802 | 229 | 0 | 16.8% | 28.6% | 0.0% | 0.0% |
| TEXAS | Harris County - Tdc - Pam Lychner | 130 | 29 | 0 | 67 | 27 | 0 | 22.3% | 40.3% | 0.0% | 0.0% |
| TEXAS | Harris County - Us Marshal, Southern District, Tx | 158 | 137 | 0 | 31 | 31 | 0 | 86.7% | 100.0% | 0.0% | 0.0% |
| TEXAS | Hidalgo County - Alamo Police Dept. | 68 | 8 | 0 | 26 | 6 | 0 | 11.8% | 23.1% | 0.0% | 0.0% |
| TEXAS | Hidalgo County - Donna Police Dept. | 55 | 13 | 0 | 28 | 8 | 0 | 23.6% | 28.6% | 0.0% | 0.0% |
| TEXAS | Hidalgo County - Edinburg Police Department | 58 | 8 | 0 | 46 | 11 | 0 | 13.8% | 23.9% | 0.0% | 0.0% |
| TEXAS | Hidalgo County - Hidalgo County Jail | 707 | 264 | 0 | 489 | 198 | 0 | 37.3% | 40.5% | 0.0% | 0.0% |
| TEXAS | Hidalgo County - Mission Police Dept. | 80 | 19 | 0 | 34 | 6 | 0 | 23.8% | 17.6% | 0.0% | 0.0% |
| TEXAS | Hidalgo County - US Marshalls, Southern District Texas | 208 | 195 | 0 | 3 | 2 | 0 | 93.8% | 66.7% | 0.0% | 0.0% |
| TEXAS | Howard County - Bscc Flightline Unit | 375 | 58 | 0 | 185 | 42 | 0 | 15.5% | 22.7% | 0.0% | 0.0% |
| TEXAS | McLennan County - Mclennan County Jail | 98 | 49 | 0 | 68 | 44 | 0 | 50.0% | 64.7% | 0.0% | 0.0% |
| TEXAS | Midland County - Midland Detention Center | 51 | 47 | 0 | 36 | 35 | 0 | 92.2% | 97.2% | 0.0% | 0.0% |
| TEXAS | Montgomery County - Montgomery County Jail | 119 | 53 | 0 | 125 | 50 | 0 | 44.5% | 40.0% | 0.0% | 0.0% |
| TEXAS | Nueces County - Nueces County Jail | 50 | 16 | 0 | 19 | 8 | 0 | 32.0% | 42.1% | 0.0% | 0.0% |
| TEXAS | Reeves County - Reeves County Det. Center | 113 | 11 | 0 | 132 | 24 | 0 | 9.7% | 18.2% | 0.0% | 0.0% |
| TEXAS | Starr County - Starr County Jail | 152 | 45 | 0 | 65 | 24 | 0 | 29.6% | 36.9% | 0.0% | 0.0% |
| TEXAS | Tarrant County - Arlington Police Dept. | 91 | 17 | 0 | 41 | 8 | 0 | 18.7% | 19.5% | 0.0% | 0.0% |
| TEXAS | Tarrant County - Mansfield L.E. Center | 60 | 14 | 0 | 80 | 39 | 0 | 23.3% | 48.8% | 0.0% | 0.0% |
| TEXAS | Tarrant County - Tarrant County Jail | 162 | 29 | 0 | 171 | 60 | 0 | 17.9% | 35.1% | 0.0% | 0.0% |
| TEXAS | Taylor County - Texas Doc - Middleton Unit | 75 | 44 | 0 | 117 | 104 | 0 | 58.7% | 88.9% | 0.0% | 0.0% |
| TEXAS | Travis County - Austin DRO Hold Room | 60 | 11 | 0 | 7 | 3 | 0 | 18.3% | 42.9% | 0.0% | 0.0% |
| TEXAS | Travis County - Travis Cty Jail | 744 | 236 | 0 | 655 | 421 | 4 | 31.7% | 64.3% | 0.0% | 0.6% |
| TEXAS | Walker County - Holliday Transfer Unit | 212 | 131 | 0 | 95 | 78 | 0 | 61.8% | 82.1% | 0.0% | 0.0% |
| TEXAS | Walker County - Huntsville State P. | 204 | 98 | 0 | 227 | 152 | 0 | 48.0% | 67.0% | 0.0% | 0.0% |
| TEXAS | Walker County - Texas Dcj - Goree Unit | 101 | 77 | 0 | 3 | 3 | 0 | 76.2% | 100.0% | 0.0% | 0.0% |
| TEXAS | Webb County - Webb County Jail | 271 | 265 | 0 | 173 | 168 | 0 | 97.8% | 97.1% | 0.0% | 0.0% |
| TEXAS | Willacy County - Ci Willacy | 147 | 131 | 0 | 0 | 0 | 0 | 89.1% | 0.0% | 0.0% | - |
| TEXAS | Williamson County - Williamson County Jail | 147 | 64 | 0 | 58 | 34 | 0 | 43.5% | 58.6% | 0.0% | 0.0% |
| UTAH | Utah County - Utah County Jail | 78 | 45 | 0 | 44 | 15 | 0 | 57.7% | 34.1% | 0.0% | 0.0% |
| VIRGINIA | Arlington County - Arlington County Jail | 107 | 17 | 0 | 41 | 18 | 0 | 15.9% | 43.9% | 0.0% | 0.0% |
| VIRGINIA | Chesterfield County - Chesterfield Co. Jail | 86 | 31 | 0 | 41 | 22 | 0 | 36.0% | 53.7% | 0.0% | 0.0% |
| VIRGINIA | Fredericksburg City - Rapp Sec Center | 59 | 16 | 0 | 23 | 13 | 0 | 27.1% | 56.5% | 0.0% | 0.0% |
| VIRGINIA | Loudoun County - Loudoun County | 68 | 12 | 0 | 26 | 8 | 0 | 17.6% | 30.8% | 0.0% | 0.0% |
| WASHINGTON | Pierce County - Pierce County Jail | 64 | 17 | 0 | 15 | 7 | 0 | 26.6% | 46.7% | 0.0% | 0.0% |
| WISCONSIN | Milwaukee County - Milwaukee County Jail | 70 | 21 | 0 | 27 | 8 | 0 | 30.0% | 29.6% | 0.0% | 0.0% |
Footnotes
[1] ICE lists law enforcement agencies by county that passed legislation or adopted restrictive policies limiting their cooperation in turning over individuals to ICE custody in response to detainers the agency issued.
[2] The data for the most recent period reflect ICE's records as of April 4, 2016. While ICE data indicate that the typical lag between when an I-247 is issued and the transfer to ICE custody takes place is 19 days and the most common is just a single day, a small number of recorded custody transfers occur more than four months after a I- 247 form is issued. Thus, for the most recent time period these figures may slightly undercount the transfers that eventually will occur.