What Happens When Individuals Are Released On Bond in Immigration Court Proceedings?
Court records show that at least half - and in some years upwards of two-thirds - of individuals are held in ICE custody at the time the Department of Homeland Security (DHS) starts Immigration Court proceedings seeking to deport them. As the backlog in the Immigration Court continues to grow and wait times increase,[1] the issue of whether individuals should remain locked up while their Immigration Court case is pending has garnered increased attention.
Even though detained individuals receive priority in scheduling court hearings, some individuals remain locked up for many months and even years before their cases are finally concluded. [2] A growing number of lawsuits in federal courts are challenging the constitutionality of locking up individuals during this period when their detention is "prolonged."[3]
The government argues that continued detention is needed to ensure that these individuals will not abscond and will show up for their hearing. For a smaller subset, there also may be public safety concerns. However, detention imposes real costs. There are to begin with the costs to taxpayers who foot the substantial bill to keep individuals locked up even though there has been no finding that the individual is actually deportable. But there are also real and significant costs to the individuals who are being detained, and frequently also to their family members.
It is unquestioned that the loss of freedom and all that this implies often imposes substantial hardships. Further, it is widely acknowledged that it is more difficult to carry out activities necessary to mount a successful defense in the deportation proceeding itself when individuals remain locked up.
Some individuals, but historically only a minority, have been able to challenge the necessity of their continued detention in a hearing before an immigration judge. However, due in part to court rulings, the right to a hearing before an immigration judge to challenge ICE's decision to keep individuals detained has been extended to a wider group of individuals. Unfortunately, very little information has been published by the Immigration Court on these custody hearings, leaving many questions unanswered. These questions include:
What proportion of detained individuals in Immigration Court hearings actually receive a custody hearing before a judge?
Once they receive a hearing, how often do immigration judges grant bond or release persons on personal recognizance?
Do individuals who are released as a result of these decisions then abscond or do they show up for their subsequent court hearings?
And finally what ultimately happens in their removal cases, does the court find they are actually deportable?
This report for the first time seeks to address these fundamental questions. It uses the court's own case-by-case records on each custody hearing, matched with parallel case-by-case records on what ultimately happens in their subsequent removal proceeding. The underlying court records were obtained by the Transactional Records Access Clearinghouse (TRAC) at Syracuse University from the Executive Office for Immigration Review (EOIR) under the Freedom of Information Act (FOIA).
Results presented are based upon a detailed analysis of these records by TRAC. The analysis spanned the last twenty years. In brief, TRAC's findings are as follows:
First, the proportion of detained individuals in Immigration Court proceedings receiving custody hearings before an immigration judge has risen from one in five, to about half over the last twenty years.
Second, the bond request was frequently turned down -- sometimes more, and sometimes a bit less than half the time. For those granted bond, about one in five remained detained until the end of their case, presumably because they were unable to post the bond amount set.
Third, for those who posted bond and were then released, relatively few individuals currently abscond. During FY 2015, for example, only 14 percent failed to turn up at their subsequent court hearing.
Fourth most individuals who were released prevailed in their court proceedings. Last year fully two out of every three (68%) won their case and were found not to be deportable.
Details on these findings are presented below. This report expands the topics covered in TRAC's extensive publication series on Immigration Court matters, and was made possible through the support of Syracuse University and a recent grant from the Carnegie Corporation of New York.
How Many Individuals Receive Immigration Court Custody Hearings?
During FY 2015, immigration court records show that a total of 50,654 individuals received custody hearings before a judge, up from 14,169 twenty years earlier. Much of this increase reflects the growing number of detained individuals in Immigration Court. As shown in Figure 1 and Appendix Table 1, individuals detained at the start of their immigration proceedings generally grew from 66,000 in FY 1995 to nearly 164,000 in FY 2011, and then declined back to roughly 98,000 last year as overall court filings declined.[4]
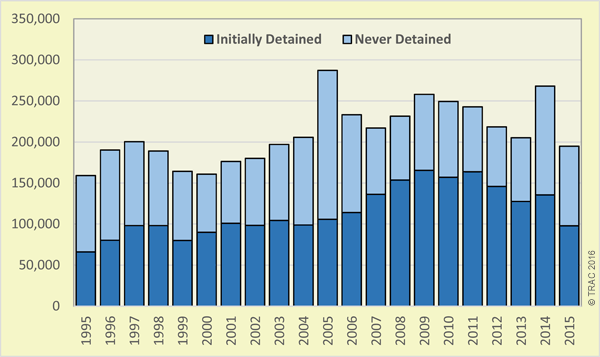
Figure 1. Immigration Court Filings by Detention Status, FY 1995 - FY 2015
For many years about one in four initially detained individuals received custody hearings before an immigration judge. Although this percentage has varied a bit from year to year, during the fifteen-year period between FY 1995 and FY 2010 it rarely was as low as 20 percent, or higher than 30 percent.
As shown in Figure 2, since FY 2010 the picture has changed. There are a growing proportion of detainees receiving bond hearings. During FY 2015 custody hearings were held for half of those detained. While hearing numbers jumped to over 66,000 in FY 2011 and FY 2012, since then the number of individuals with custody hearings has been falling. What has happened is that the number of individuals in detained proceedings has fallen faster, so that the proportion with custody hearings still increased. See Figure 2 and Appendix Table 1.
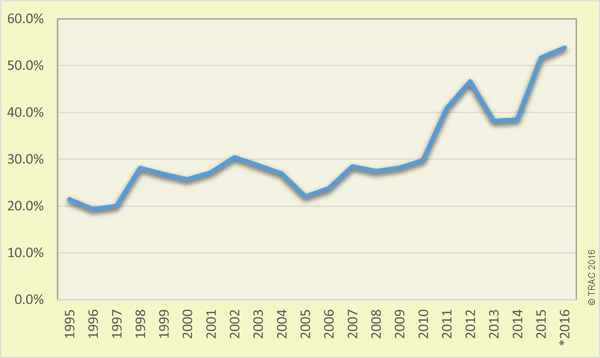
Figure 2. Percent of Initially Detained Individuals Afforded Custody Hearing
How Often Do Immigration Judges Grant Bond or Release on Personal Recognizance?
On average over this twenty-year period, slightly more than half (54%) of bond hearings resulted in the immigration judge denying the bond motion. In the remaining 46 percent, the bond motion was granted.[5] There has been considerable year-to-year variation in these rates. In general, judges are no more likely to grant bond today than they were twenty years ago.
Figure 3 displays this release rate from a slightly different angle - those released as compared with the total number of individuals in detained immigration proceedings. Historically, only one in ten detained individuals had a favorable judge ruling at a bond hearing. Last year three out of every ten detained individuals had a bond motion granted by an immigration judge. This increase reflects the growing proportion of detained individuals who had hearings. See Figure 3 and Appendix Table 1.
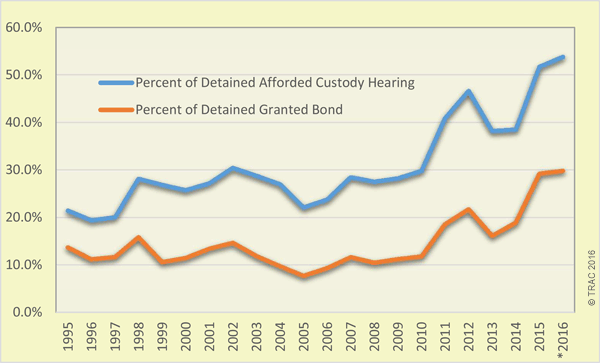
Figure 3. Percent of Detained with Custody Hearings and Granted Bond
The character of bond hearings has also changed over the past two decades. Twenty years ago court records indicate in three out four cases an initial bond had been set by the immigration enforcement officials and the hearing was over whether the bond amount should be reduced -- not whether the individual should be released at all. However, the number of these cases has steadily dwindled. By FY 2015, in 94 percent of the cases ICE was apparently insisting that the individual must be kept locked up since court records indicated enforcement officials had not set any bond amount. Accordingly, the judge was being asked to set a bond to allow the individual to be released.
When the bond motion was granted, bond amounts naturally varied. A few were granted release on personal recognizance, or the bond amount was simply set at $0. At the other extreme, occasionally bond amounts of a million dollars or more were set by the judge. The median bond amount set twenty years ago was $3,000. By FY 2002 it rose to $5,000 where it remained until FY 2014 when it increased to $6,000. In FY 2015 the median bond amount was $6,500. See Appendix Table 2.
Figure 4 shows, where bond was granted, the distribution of the amount of bond set by the judge in each of the past five years. In FY 2015 fully half of all bonds set were between $4,000 and $10,000. A total of four percent did not have to post any bond, while according to court records, seven individuals had bonds set of over a million dollars.
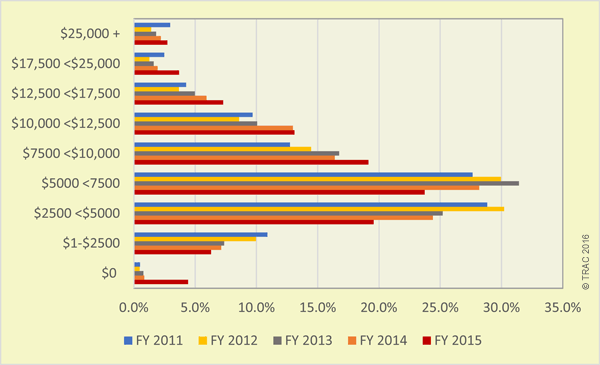
Figure 4. Bond Amounts Set by Immigration Judge
For those granted bond, having a bond set still was not synonymous with being released. While figures varied from year to year, according to court records about one in five remained detained at the conclusion of their case, presumably because they were unable to post that bond amount. For cases concluded during FY 2015, 13 percent remained detained even after the judge granted bond, down from 28 percent who had still been detained at the conclusion of their case in FY 2011 after bond was granted. See Appendix Table 3.
The remaining sections of this report focus on those individuals who secured their release from detention. That is, they had a bond hearing before a judge, were then successful in having their motion granted, and finally were as a result released from ICE custody.
Did Released Individuals Turn Up at Their Subsequent Court Hearings?
The vast majority of individuals who in recent years were released on bond as a result of their custody hearing before an immigration judge turned up for their court case. During FY 2015, for example, court records indicate that 86 percent of individuals that were released from detention turned up for their court hearing when it was finally held. The remaining 14 percent were recorded "in absentia." That is, they failed to appear and the immigration judge - in their absence -- granted the government's request for a removal order to deport them.[6]
The appearance rate of those released as a result of a custody hearing before an immigration judge is generally better - that is, higher -- than for individuals that immigration enforcement officials have themselves released from custody. The "in absentia" rate overall for released individuals during FY 2015, for example, was 23.4 percent[7], as compared to only 14.0 percent for the subset of those released after an immigration judge had set bond. This is noteworthy since the cases immigration judges were reviewing were almost always those where the government had refused to release the individual. Such cases, if the system operated logically, would be thought to present a higher, not lower, flight risk.
In general, in absentia rates for individuals released as a result of bond decisions made by immigration judges also were down from levels of ten or more years ago. In absentia rates for individuals released after their custody hearings peaked at 47 percent during FY 2002 and have generally fallen since then despite the increasing percentage of detained individuals being released on bond by judges[8]. See Figure 5 and Appendix Table 3.
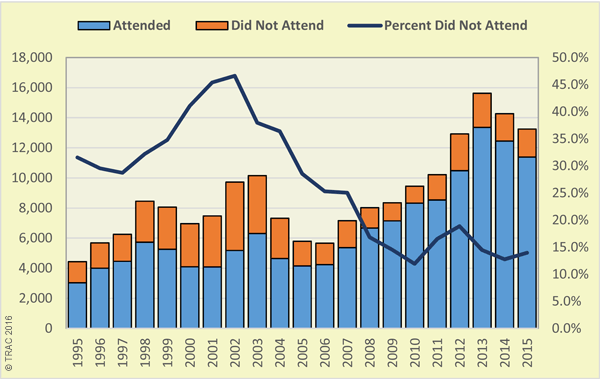
Figure 5. Whether Individuals Released from Detention After Bond Granted by Immigration Judge Abscond
Immigration Judge Decisions on Deportation and Removal Proceedings
Individuals who gain their release in a bond hearing also have a very high success rate in establishing that they should not be deported in the first place, and can therefore remain in the U.S. During FY 2015, for example, two out of every three individuals (68%) released after the judge granted bond ultimately prevailed in their Immigration Court proceeding.
The remaining proportion ordered deported - that is, one out of three - was significantly lower than those ordered deported overall in Immigration Court proceeding completed last year. As TRAC has previously reported, in FY 2015 the overall proportion of individuals ordered deported in Immigration Court proceedings was just under half, or 46 percent.
Outcomes in deportation and removal proceedings over the past two decades for individuals released after a judge granted bond in their custody hearing are shown in Figure 6 and Appendix Table 4. As can be seen, these individuals who have been released from detention have over time increasingly prevailed in their Immigration Court cases.
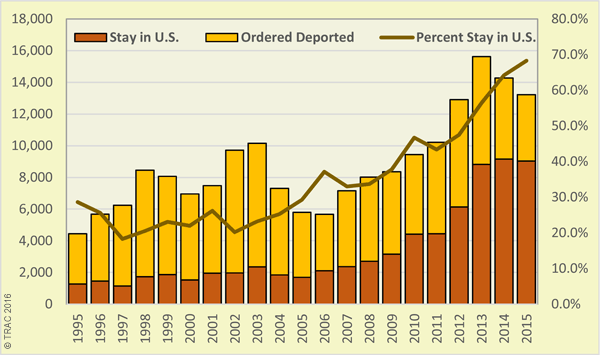
Figure 6. Outcome in Immigration Deportation Proceedings Where Individual Released After Judge Granted Bond
Conclusion
Court records so far demonstrate that the practical result of the release of increasing numbers of individuals on bond has not resulted in any significant increase in those who abscond and fail to show up for their immigration hearings. Trends, if anything, show declines. At the same time, it has allowed thousands of individuals who ultimately were found not to be deportable to avoid being held during their lengthy court proceedings. The number of those judged not deportable who escaped unnecessary detention grew over the last decade from 1,697 individuals in FY 1995 to 9,158 individuals in FY 2015.
Footnotes
[1] See, for example, July 2016 TRAC report on increasing backlogs, and September 2015 report on ballooning wait times.
[2] See, for example, recent EOIR statistics. Also see TRAC report that found legal noncitizens had received the longest ICE detention times simply because of the lengthy procedures required to prove they had the legal right to remain in the U.S.
[3] The U.S. Supreme Court, for example, recently granted certiorari to review the Ninth Circuit's Rodriquez opinion in a class action involving prolonged detention in Immigration Court proceedings holding that those individuals had a right to a bond hearing before an Immigration judge. See also, Denmore v. Kim, 538 U.S. 510 (2003).
[4] These recent declines reflect the decrease in the overall number of court filings after FY 2011 in large part because of DHS's increasing reliance on administrative deportation procedures that bypass the Immigration Court. The larger number in FY 2014 reflects cases from the surge of unaccompanied children and women with children that arrived that year seeking refuge in this country
[5] For individuals who had multiple bond hearings, figures are based upon the outcome of the last hearing. Grant rates are lower if counts include all hearings since unsuccessful candidates account for most requests for repeat hearings.
[6] Given the Court's backlog, there was typically a long delay between the date of their bond hearing and the hearing that concluded removal proceedings. For example, the median bond hearing date for FY 2015 dispositions was back in April 2012.
[7] This rate, using the same methodology, compares the total number of
in absentia decisions in cases in which the individuals had been released from custody to the total cases involving released individuals concluded that year. These results are also shown in Appendix Table 3. Where there have been multiple proceedings for the same individual, the outcome for the last - that is, final -- proceeding is used. TRAC's result differs from what EOIR publishes as its "in absentia" rate for the following two reasons. First, EOIR's rate is based upon the initial, rather than the last proceeding. If this rate is being used as an indicator of individuals absconding, rather than simply failing to appear, then using the first proceeding and ignoring subsequent ones is quite inappropriate. Where, for example, the individual never received notice of the hearing, the case may be reopened and a later hearing take place. Use of the last proceeding, rather than the first, is thus a more accurate measure in this context. In fact, using the last proceeding instead of the first significantly impacts and reduces the calculated rates. Second, EOIR unlike TRAC does not include all individuals with hearings that conclude their case, choosing to exclude some because of the particular type of decision the court ultimately made. While anyone who absconded would not be qualified to receive the type of decision that EOIR labels as "other completions", the agency excludes these from its total case completion count when computing in absentia rates. Although formerly insignificant in number, these "other completions" have grown in recent years. They have the same practical effect of closing the case and allowing the individual to remain in the U.S. In FY 2015, these "other completions" made up around a quarter of the cases the court decided. EOIR appears to continue to exclude them for what appears to be largely historical reasons when its case counting methodology was quite different. No rationale now for their current exclusion remains. Indeed, continuing to exclude them results in publishing misleading and greatly inflated in absentia rates.[8] Supplemental Note (October 6, 2016). TRAC just completed a supplemental analysis of the subset of cases that EOIR recently began identifying as "individuals released from custody as a result of a bond hearing conducted pursuant to the decision in Rodriguez v. Robbins, 804 F.3rd 1060 (9th Cir. 2015)." TRAC found there are a relatively small number that EOIR has identified thus far as applicable Rodriguez cases. In addition, only a very few of these Rodriguez cases have reached a conclusion on their merits. As a result it is much too early to even attempt to determine what proportion ultimately will be decided "in absentia." To place these very preliminary numbers into context, TRAC reported in Appendix Table 3 that during the first 10 months of FY 2016 there were 12,022 cases of all types that had been concluded in which the individual earlier had been released from custody as a result of immigration judges granting them bond. TRAC found only two out of the 12,022 were identified as Rodriguez cases and, according to Immigration Court records, both of these released individuals showed up for their immigration hearings.
Appendix
| Fiscal Year | New Court Filings | Custody Hearings* | Percentage of Detained | |||
|---|---|---|---|---|---|---|
| Total | Individual Detained | All | Bond Granted** | With Custody Hearings | With Bond Granted | |
| 1995 | 159,135 | 66,017 | 14,169 | 9,056 | 21.46% | 13.7% |
| 1996 | 190,170 | 80,423 | 15,595 | 9,005 | 19.4% | 11.2% |
| 1997 | 200,316 | 98,094 | 19,637 | 11,462 | 20.0% | 11.7% |
| 1998 | 189,070 | 98,160 | 27,636 | 15,559 | 28.2% | 15.9% |
| 1999 | 164,186 | 80,129 | 21,515 | 8,499 | 26.9% | 10.6% |
| 2000 | 160,852 | 89,875 | 23,116 | 10,328 | 25.7% | 11.5% |
| 2001 | 176,230 | 100,980 | 27,451 | 13,540 | 27.2% | 13.4% |
| 2002 | 180,249 | 98,475 | 29,955 | 14,469 | 30.4% | 14.7% |
| 2003 | 196,905 | 104,467 | 30,040 | 12,415 | 28.8% | 11.9% |
| 2004 | 205,818 | 98,907 | 26,685 | 9,614 | 27.0% | 9.7% |
| 2005 | 287,240 | 105,838 | 23,408 | 8,164 | 22.1% | 7.7% |
| 2006 | 233,269 | 114,113 | 27,117 | 10,658 | 23.8% | 9.3% |
| 2007 | 217,088 | 136,200 | 38,793 | 15,870 | 28.5% | 11.7% |
| 2008 | 231,504 | 153,531 | 42,232 | 16,089 | 27.5% | 10.5% |
| 2009 | 258,036 | 165,500 | 46,707 | 18,563 | 28.2% | 11.2% |
| 2010 | 249,452 | 156,999 | 46,819 | 18,549 | 29.8% | 11.8% |
| 2011 | 242,932 | 163,716 | 66,913 | 30,398 | 40.9% | 18.6% |
| 2012 | 218,483 | 145,785 | 68,014 | 31,688 | 46.7% | 21.7% |
| 2013 | 205,142 | 127,573 | 48,722 | 20,587 | 38.2% | 16.1% |
| 2014 | 268,095 | 135,434 | 52,138 | 25,644 | 38.5% | 18.9% |
| 2015 | 194,798 | 97,927 | 50,654 | 28,637 | 51.7% | 29.2% |
| 2016*** | 157,664 | 80,482 | 43,317 | 23,996 | 53.8% | 29.8% |
| Fiscal Year | Number | Median Amount | Percentage by Bond Amount | |||||||||
|---|---|---|---|---|---|---|---|---|---|---|---|---|
| $0 | $1- $2,500 |
$2,500< $5,000 |
$5,000< $7,500 |
$7,500< $10,000 |
$10,000< $12,500 |
$12,500< $17,500 |
$17,500< $25,000 |
$25,000+ | Total | |||
| 1995 | 9,056 | $3,000 | 7.1% | 32.6% | 19.2% | 16.2% | 7.5% | 8.2% | 3.4% | 3.1% | 2.6% | 100.0% |
| 1996 | 9,005 | $2,500 | 5.9% | 40.7% | 23.3% | 13.3% | 5.2% | 5.7% | 2.5% | 1.9% | 1.6% | 100.0% |
| 1997 | 11,462 | $3,000 | 5.9% | 29.9% | 26.9% | 15.7% | 4.3% | 8.1% | 3.6% | 2.8% | 2.8% | 100.0% |
| 1998 | 15,559 | $3,500 | 5.0% | 19.6% | 37.7% | 17.6% | 5.1% | 7.3% | 2.8% | 2.6% | 2.2% | 100.0% |
| 1999 | 8,499 | $3,000 | 8.1% | 28.3% | 39.5% | 13.9% | 3.3% | 3.6% | 1.4% | 0.9% | 0.9% | 100.0% |
| 2000 | 10,328 | $3,000 | 5.7% | 25.7% | 35.4% | 20.1% | 3.3% | 4.1% | 2.5% | 0.9% | 2.3% | 100.0% |
| 2001 | 13,540 | $3,500 | 7.9% | 17.6% | 37.7% | 23.1% | 4.2% | 4.2% | 2.8% | 0.6% | 1.9% | 100.0% |
| 2002 | 14,469 | $5,000 | 5.7% | 14.1% | 28.0% | 23.5% | 7.1% | 8.6% | 4.9% | 2.5% | 5.5% | 100.0% |
| 2003 | 12,415 | $5,000 | 5.5% | 15.2% | 24.2% | 24.6% | 7.9% | 8.8% | 4.9% | 2.9% | 6.0% | 100.0% |
| 2004 | 9,614 | $5,000 | 4.6% | 13.0% | 21.0% | 29.3% | 10.4% | 9.5% | 3.9% | 3.4% | 4.9% | 100.0% |
| 2005 | 8,164 | $5,000 | 4.6% | 12.8% | 18.8% | 31.2% | 9.2% | 10.7% | 4.3% | 2.6% | 5.9% | 100.0% |
| 2006 | 10,658 | $5,000 | 3.4% | 14.5% | 22.3% | 27.4% | 10.1% | 10.2% | 4.7% | 2.8% | 4.6% | 100.0% |
| 2007 | 15,870 | $5,000 | 3.2% | 12.6% | 22.5% | 26.1% | 11.3% | 11.9% | 5.4% | 3.3% | 3.7% | 100.0% |
| 2008 | 16,089 | $5,000 | 1.8% | 10.4% | 26.2% | 28.0% | 11.0% | 11.9% | 4.9% | 2.7% | 3.2% | 100.0% |
| 2009 | 18,563 | $5,000 | 1.4% | 10.3% | 25.4% | 27.7% | 12.3% | 11.6% | 5.3% | 2.7% | 3.4% | 100.0% |
| 2010 | 18,549 | $5,000 | 1.1% | 12.5% | 30.6% | 27.6% | 12.2% | 8.7% | 4.0% | 1.8% | 1.6% | 100.0% |
| 2011 | 30,398 | $5,000 | 0.5% | 10.9% | 28.8% | 27.6% | 12.7% | 9.7% | 4.3% | 2.5% | 3.0% | 100.0% |
| 2012 | 31,688 | $5,000 | 0.5% | 10.0% | 30.2% | 29.9% | 14.5% | 8.6% | 3.7% | 1.3% | 1.4% | 100.0% |
| 2013 | 20,587 | $5,000 | 0.8% | 7.4% | 25.2% | 31.4% | 16.8% | 10.1% | 5.0% | 1.6% | 1.8% | 100.0% |
| 2014 | 25,644 | $6,000 | 0.8% | 7.1% | 24.4% | 28.2% | 16.4% | 13.0% | 5.9% | 1.9% | 2.2% | 100.0% |
| 2015 | 28,637 | $6,500 | 4.4% | 6.3% | 19.6% | 23.7% | 19.1% | 13.1% | 7.3% | 3.7% | 2.7% | 100.0% |
| 2016** | 23,996 | $8,000 | 0.7% | 4.1% | 12.5% | 19.9% | 22.6% | 18.0% | 9.2% | 6.5% | 6.5% | 100.0% |
| Fiscal Year Case Completed | Immigration Judge Granted Bond* | All Completions Where Released | |||||||
|---|---|---|---|---|---|---|---|---|---|
| Total | Remained Detained | Gained Release | Attended Court Hearing | Did Not Attend** | Percent "In Absentia" | Total Released | Did Not Attend** | Percent "In Absentia" | |
| 1995 | 6,820 | 2,381 | 4,439 | 3,038 | 1,401 | 31.6% | 11,898 | 4,249 | 35.7% |
| 1996 | 8,227 | 2,546 | 5,681 | 4,001 | 1,680 | 29.6% | 12,484 | 4,328 | 34.7% |
| 1997 | 9,228 | 2,977 | 6,251 | 4,455 | 1,796 | 28.7% | 12,767 | 4,145 | 32.5% |
| 1998 | 12,297 | 3,841 | 8,456 | 5,731 | 2,725 | 32.2% | 16,308 | 5,775 | 35.4% |
| 1999 | 10,214 | 2,146 | 8,068 | 5,260 | 2,808 | 34.8% | 16,226 | 6,050 | 37.3% |
| 2000 | 8,967 | 2,006 | 6,961 | 4,101 | 2,860 | 41.1% | 17,251 | 7,641 | 44.3% |
| 2001 | 9,781 | 2,302 | 7,479 | 4,082 | 3,397 | 45.4% | 22,986 | 11,098 | 48.3% |
| 2002 | 12,574 | 2,855 | 9,719 | 5,187 | 4,532 | 46.6% | 27,646 | 13,058 | 47.2% |
| 2003 | 13,310 | 3,153 | 10,157 | 6,303 | 3,854 | 37.9% | 27,258 | 11,008 | 40.4% |
| 2004 | 9,818 | 2,509 | 7,309 | 4,648 | 2,661 | 36.4% | 20,074 | 7,362 | 36.7% |
| 2005 | 7,765 | 1,969 | 5,796 | 4,142 | 1,654 | 28.5% | 17,287 | 5,951 | 34.4% |
| 2006 | 7,783 | 2,113 | 5,670 | 4,235 | 1,435 | 25.3% | 18,387 | 5,899 | 32.1% |
| 2007 | 9,858 | 2,697 | 7,161 | 5,368 | 1,793 | 25.0% | 19,082 | 5,243 | 27.5% |
| 2008 | 10,656 | 2,635 | 8,021 | 6,671 | 1,350 | 16.8% | 19,111 | 4,137 | 21.6% |
| 2009 | 11,353 | 3,000 | 8,353 | 7,140 | 1,213 | 14.5% | 18,336 | 3,764 | 20.5% |
| 2010 | 12,184 | 2,735 | 9,449 | 8,322 | 1,127 | 11.9% | 20,583 | 3,845 | 18.7% |
| 2011 | 14,211 | 3,985 | 10,226 | 8,537 | 1,689 | 16.5% | 24,587 | 5,778 | 23.5% |
| 2012 | 17,023 | 4,109 | 12,914 | 10,480 | 2,434 | 18.8% | 29,573 | 6,821 | 23.1% |
| 2013 | 18,504 | 2,876 | 15,628 | 13,370 | 2,258 | 14.4% | 36,307 | 8,260 | 22.8% |
| 2014 | 17,221 | 2,951 | 14,270 | 12,448 | 1,822 | 12.8% | 38,685 | 9,547 | 24.7% |
| 2015 | 15,269 | 2,028 | 13,241 | 11,391 | 1,850 | 14.0% | 44,280 | 10,379 | 23.4% |
| 2016*** | 13,485 | 1,463 | 12,022 | 10,009 | 2,010 | 16.7% | 38,770 | 7,912 | 20.4% |
Where Individual Released After Judge Granted Bond
| Fiscal Year Case Completed |
Total* | Stay in U.S. | Ordered Deported |
Percent Stay in U.S. |
|---|---|---|---|---|
| 1995 | 4,439 | 1,272 | 3,167 | 28.7% |
| 1996 | 5,680 | 1,457 | 4,223 | 25.7% |
| 1997 | 6,249 | 1,142 | 5,107 | 18.3% |
| 1998 | 8,456 | 1,734 | 6,722 | 20.5% |
| 1999 | 8,068 | 1,862 | 6,206 | 23.1% |
| 2000 | 6,961 | 1,528 | 5,433 | 22.0% |
| 2001 | 7,479 | 1,959 | 5,520 | 26.2% |
| 2002 | 9,719 | 1,965 | 7,754 | 20.2% |
| 2003 | 10,156 | 2,355 | 7,801 | 23.2% |
| 2004 | 7,308 | 1,848 | 5,460 | 25.3% |
| 2005 | 5,796 | 1,697 | 4,099 | 29.3% |
| 2006 | 5,670 | 2,106 | 3,564 | 37.1% |
| 2007 | 7,160 | 2,363 | 4,797 | 33.0% |
| 2008 | 8,021 | 2,703 | 5,318 | 33.7% |
| 2009 | 8,351 | 3,156 | 5,195 | 37.8% |
| 2010 | 9,449 | 4,415 | 5,034 | 46.7% |
| 2011 | 10,226 | 4,437 | 5,789 | 43.4% |
| 2012 | 12,914 | 6,135 | 6,779 | 47.5% |
| 2013 | 15,627 | 8,814 | 6,813 | 56.4% |
| 2014 | 14,268 | 9,158 | 5,110 | 64.2% |
| 2015 | 13,225 | 9,031 | 4,194 | 68.3% |
| 2016** | 12,012 | 8,040 | 3,972 | 66.9% |