Ballooning Wait Times for Hearing Dates
in Overworked Immigration Courts
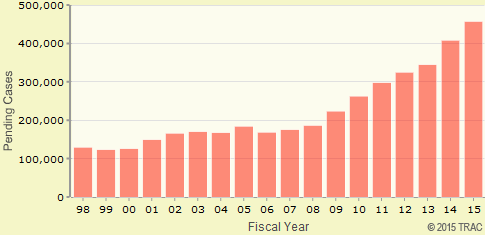
There were nearly a half million individual deportation cases (456,644) pending before the judges in the nation's clearly overwhelmed Immigration Courts at the end of August, according to the very latest information obtained from the U.S. Department of Justice and analyzed by the Transactional Records Access Clearinghouse (TRAC). This backlog has been rising steadily for nearly a decade and has reached yet another new all-time high.
As a result, the average wait time for an individual in the Immigration Court's pending cases list has also reached an all-time high of 635 calendar days. But this average wait time only measures how long these individuals have already been waiting, not how much longer they will have to wait before their cases are resolved.
The severity of the rapidly growing crisis was revealed last January, when the court issued thousands of letters notifying individuals that their cases would be delayed for nearly five years more — until November 29, 2019. The Executive Office for Immigration Review (EOIR), which operates these courts, explained that the move was needed to make room in its hearing schedule for higher priority cases due to the flood of unaccompanied minors and mothers with children who crossed the border last year. The EOIR was widely quoted as saying, however, that the 2019 date was just a temporary placeholder, and offered assurances that the majority of cases would "probably" soon be rescheduled to earlier dates.
for details see TRAC's Immigration Court Backlog tool, updated monthly
It has now been more than seven months since this initial wave of rescheduling notices was issued and the situation is worsening; the backlog of pending cases is currently up 11.9 percent since the beginning of this fiscal year. Furthermore, it is about a third (32.7%) higher than it was at the beginning of fiscal year 2014 (see Figure 1).
As previously noted, there were 456,644 cases pending before the Immigration Courts at the end of August 2015. This means the court backlog has increased by more than 100,000 cases from the 344,230 that were pending at the beginning of FY 2014.
Current Wait Times for a Hearing Before an Immigration Judge
As of the end of August 2015, the court's pending workload included 421,647 scheduled hearings, with an average additional wait of 436 calendar days. Note that this is based upon the average additional number of days after August 31 that individuals will have to wait until their scheduled hearing. Since the average individual has already been waiting 635 days, the projected total time from the date their case was filed until their hearing date is 635 days + 436 days, or a total of 1,071 days — just under three years (35.2 months).
Have to Wait for a Scheduled Hearing?
| Wait Times Until Scheduled Hearing | Total Projected Wait Days* | ||
|---|---|---|---|
| 10% | within 24 days | 635 + 24 | 659 |
| 20% | within 52 days | 635 + 52 | 687 |
| 30% | within 92 days | 635 + 92 | 727 |
| 40% | within 142 days | 635 + 142 | 777 |
| 50% | within 197 days | 635 + 197 | 832 |
| 60% | within 281 days | 635 + 281 | 916 |
| 70% | within 429 days | 635 + 429 | 1,064 |
| 80% | within 728 days | 635 + 728 | 1,363 |
| 90% | within 1,551 days | 635 + 1,551 | 2,186 |
| 100% | within 1,766 days | 635 + 1,766 | 2,401 |
Some individuals with pending cases will of course have to wait longer for a hearing while some will have a shorter wait. Table 1 presents information on the variation in wait times until a hearing is scheduled. The court now gives priority in scheduling hearings to unaccompanied minors, adults with children, and individuals who are detained or in custody. In fact, ten percent of the upcoming hearings are scheduled within 24 calendar days.
But how about the rest of the hearing dates? A total of 55,676 cases, or 13.2 percent of all hearings, are still scheduled some 1,551 days out — for November 29, 2019, the date set in that initial wave of court notices issued last January. But thousands of hearings won't commence until even later; for ten percent, the wait time for the hearings ranged from 1,552 days to 1,766 days into the future.
Master versus Individual Hearings
According to court records, seventy-one percent of all these scheduled hearings are what the court calls "master calendar hearings." As EOIR explains, an individual's first appearance before an Immigration Judge in a removal proceeding is at a master calendar hearing. At that point, many individuals are then scheduled to appear at a later session. The purpose of the master calendar hearing is to advise the individuals of their rights, explain the removal charges the government has filed against them, take pleadings, identify and attempt to narrow the factual and legal issues, and set deadlines for filing any papers needed for subsequent hearings.
Thus, except for individuals who want to immediately agree to their removal, the "master calendar hearing" is only the first hearing — not the last. Even after waiting for this hearing, generally at least one and perhaps several additional hearings will need to be scheduled. With schedules already so backed up, these added court hearings will delay a case even longer than the projected times shown in Table 1.
As another illustration of how much longer many individuals may need to wait, court records indicate that 63,208 master calendar hearings are currently not scheduled until November 29, 2019 or later.
Hearings Scheduled and Wait Times by Hearing Location
Wait times vary a great deal from one Immigration Court location to another. Some courts focus virtually exclusively on priority cases, such as individuals who are detained or are unaccompanied juveniles. For these, wait times will of course be much shorter. Conversely, wait times can be much longer in locations where a court is particularly understaffed with too few Immigration Court judges relative to their caseload.
Information about the wait times for the 136 Immigration Court hearing locations (by state) with at least 25 pending cases at the end of August 2015 can be found in Table 2 below. Included in the table are the number of pending cases along with the average number of days these cases have already waited — the traditional backlog and wait times. Next to these columns is the average number of additional days that cases are waiting for a hearing before an Immigration Judge, based on TRAC's new analysis of the scheduled hearings in each court. In the next column is the total projected wait time — the average days "already waited" plus the average of "more until hearing" has been scheduled.
Also listed is the calendar date of the latest hearing scheduled, which translates into the maximum period a pending case must wait until its hearing beyond August 31, according to the court's current calendar. (The table is interactive, so you can sort any column by clicking on its heading.)
Of course, hearings can be rescheduled sooner or moved later, so these statistics are merely projected figures for the average wait time based on the court's hearing schedule as of the end of August. In addition, it does not include any estimate of potential future delays that may be involved if there is a need for one or more additional hearings after the one now scheduled. Nonetheless these data provide a sobering snapshot of the current state of the Court's docket and what this implies about the long delays facing many individuals before their cases can be heard.
Focusing just on the number of wait days for cases pending at the end of August, Oklahoma City's hearing location had racked up the most — an average of 1,004 days. The others that made up the top five — all with average days above 900 for individuals with pending cases — were Chicago, Illinois and Detroit, Michigan each tied for second place, followed by Omaha, Nebraska in fourth and Denver, Colorado in fifth.
However, based upon scheduled hearing dates, even in this top five there were remarkably different averages for the additional number of days before a hearing was scheduled. These varied from an average additional 153 days in Oklahoma City to 1,434 additional days in Detroit. For Oklahoma City, the latest scheduled hearing date for anyone was June 20, 2016, less than a year away. In Chicago hearings were scheduled all the way through July 1, 2020.
Once we include the additional days before a hearing was actually scheduled, the total projected wait times for pending cases ranges from an average of 22 days at the San Francisco, California video hearing location and 24 days at the David L. Moss Criminal Justice Center in Oklahoma all the way up to 2,371 days for Detroit, Michigan.
Again, these projected wait times are based upon the current court hearing schedule. An unusually large number of additional days at a location often reflects the significant number of individuals assigned a November 29, 2019 hearing date. In Detroit, for example, over 75 percent of pending cases had been scheduled to be heard on that date. Clearly, that date is just a placeholder and schedules will have to change since that volume of cases cannot be accommodated in such a short time.
TRAC will continue to monitor changes in the scheduling of Immigration Court hearings and publish periodic updates to these figures.
Conclusion
The government data in this report provide concrete information about the extraordinary challenges — in terms of both enforcement and fairness — now facing the Immigration Courts. These issues in turn are becoming an increasingly important part of the current political debate over the country's immigration policies.
by Immigration Court Hearing Location, as of August 31, 2015
(Click on column header to sort)
| State | Hearing Location | Pending Cases |
Average Days | Latest Hearing Date Scheduled* |
||
|---|---|---|---|---|---|---|
| Already Waited | More Until Hearing* | Projected Total Wait* | ||||
| TX | Oklahoma City, Oklahoma | 400 | 1,004 | 153 | 1,157 | 2016-06-20 |
| IL | Chicago, Illinois | 16,717 | 937 | 790 | 1,727 | 2020-07-01 |
| MI | Detroit, Michigan | 3,359 | 937 | 1,434 | 2,371 | 2019-11-29 |
| NE | Omaha, Nebraska | 4,588 | 928 | 370 | 1,298 | 2019-11-29 |
| CO | Denver, Colorado | 8,571 | 906 | 1,082 | 1,988 | 2019-11-29 |
| AZ | Phoenix, Arizona | 9,957 | 853 | 289 | 1,142 | 2019-12-18 |
| CA | Imperial, California | 1,830 | 819 | 584 | 1,403 | 2018-07-06 |
| OH | Cleveland, Ohio | 5,848 | 811 | 522 | 1,333 | 2020-04-23 |
| NV | Las Vegas, Nevada | 3,359 | 789 | 174 | 963 | 2017-12-21 |
| CA | Los Angeles, California | 51,264 | 788 | 194 | 982 | 2019-11-29 |
| TX | El Paso, Texas | 5,860 | 782 | 346 | 1,128 | 2018-05-01 |
| MA | Boston, Massachusetts | 9,953 | 733 | 350 | 1,083 | 2020-05-04 |
| NJ | Newark, New Jersey | 23,183 | 727 | 666 | 1,393 | 2019-11-29 |
| PA | Philadelphia, Pennsylvania | 4,411 | 723 | 135 | 858 | 2017-06-29 |
| TX | Houston, Texas | 32,902 | 709 | 1,077 | 1,786 | 2019-12-04 |
| GA | Atlanta, Georgia | 12,617 | 698 | 576 | 1,274 | 2019-11-29 |
| OR | Portland, Oregon | 1,623 | 692 | 350 | 1,042 | 2018-05-21 |
| ID | Boise, Idaho | 435 | 690 | 237 | 927 | 2017-10-25 |
| CA | San Francisco, California | 30,446 | 684 | 357 | 1,041 | 2019-11-29 |
| NY | Buffalo, New York | 2,371 | 670 | 208 | 878 | 2017-01-31 |
| KY | Louisville, Kentucky | 3,065 | 652 | 364 | 1,016 | 2019-04-08 |
| UT | Salt Lake City, Utah | 1,420 | 648 | 172 | 820 | 2017-01-09 |
| AZ | Tucson, Arizona | 840 | 644 | 76 | 720 | 2016-04-26 |
| MN | Bloomington — BLM | 2,962 | 638 | 1,092 | 1,730 | 2019-11-29 |
| VA | Arlington, Virginia | 18,199 | 637 | 577 | 1,214 | 2019-12-27 |
| NY | New York City, New York | 61,854 | 633 | 299 | 932 | 2019-11-29 |
| TX | San Antonio, Texas | 21,384 | 624 | 1,107 | 1,731 | 2019-11-29 |
| TX | Harlingen, Texas | 4,984 | 569 | 258 | 827 | 2017-06-28 |
| PA | Pittsburgh, Pennsylvania | 297 | 555 | 73 | 628 | 2016-07-27 |
| MO | Kansas City, Missouri | 4,183 | 552 | 432 | 984 | 2019-11-29 |
| NV | Reno, Nevada | 290 | 542 | 129 | 671 | 2016-12-06 |
| CT | Hartford, Connecticut | 1,562 | 522 | 174 | 696 | 2017-02-28 |
| TX | Dallas, Texas | 6,739 | 509 | 202 | 711 | 2019-11-29 |
| FL | Miami, Florida | 19,741 | 499 | 475 | 974 | 2019-11-29 |
| WA | Seattle, Washington | 6,468 | 468 | 197 | 665 | 2018-10-01 |
| LA | New Orleans, Louisiana | 6,875 | 462 | 160 | 622 | 2017-01-30 |
| TN | Memphis, Tennessee | 5,102 | 440 | 224 | 664 | 2017-12-05 |
| FL | Orlando, Florida | 5,191 | 438 | 101 | 539 | 2016-12-01 |
| OH | Ohio Dept. of Corr., Correctional Reception Center — ORI | 34 | 434 | 110 | 544 | 2019-03-14 |
| MD | Baltimore, Maryland | 11,712 | 431 | 149 | 580 | 2017-12-20 |
| AK | Anchorage, Alaska | 46 | 419 | 79 | 498 | 2016-06-17 |
| NY | Downstate Correctional Facility | 98 | 383 | 34 | 417 | 2015-12-16 |
| CA | San Diego, California | 2,981 | 362 | 88 | 450 | 2016-04-13 |
| AZ | Arizona DOC- Perryville | 25 | 309 | 80 | 389 | 2016-05-12 |
| VI | St. Thomas, Virgin Islands | 66 | 308 | 95 | 403 | 2016-03-16 |
| NC | Charlotte | 4,014 | 293 | 70 | 363 | 2016-10-31 |
| IL | Illinois DOC- Statesville | 86 | 281 | 130 | 411 | 2016-04-11 |
| MA | Boston, Massachusetts (BJV) | 2,155 | 268 | 124 | 392 | 2017-05-17 |
| TN | Memphis Juvenile | 1,024 | 266 | 98 | 364 | 2016-09-27 |
| TX | San Antonio Non-Detained Juvenile | 535 | 259 | 40 | 299 | 2015-11-25 |
| MN | Minnesota Correctional Facility | 76 | 258 | 291 | 549 | 2017-01-18 |
| PA | Philadelphia Juvenile | 775 | 245 | 115 | 360 | 2016-04-28 |
| TX | Texas DOC- Huntsville | 259 | 243 | 44 | 287 | 2015-12-18 |
| AZ | Arizona State Prison-Central Unit | 61 | 240 | 150 | 390 | 2016-12-06 |
| AZ | Arizona DOC- Tucson | 290 | 233 | 58 | 291 | 2016-02-11 |
| FL | North Florida Reception Center (NFC) | 71 | 232 | 32 | 264 | 2015-12-01 |
| PR | San Juan, Puerto Rico | 108 | 230 | 44 | 274 | 2016-03-21 |
| NC | Charlotte Juvenile | 1,312 | 226 | 87 | 313 | 2016-10-31 |
| CA | San Francisco Non-Detained Juveniles | 236 | 226 | 92 | 318 | 2016-04-27 |
| KY | Louisville Juvenile | 259 | 225 | 183 | 408 | 2016-10-31 |
| VA | Unaccompanied Juveniles | 3,953 | 224 | 71 | 295 | 2016-04-13 |
| TX | Karnes County Correction Center | 61 | 221 | 5 | 226 | 2015-09-08 |
| GA | Georgia Department of Corrections- Diagnostic | 58 | 221 | 69 | 290 | 2015-12-04 |
| CT | Mcdougal-Walker Correctional Institution | 31 | 218 | 43 | 261 | 2016-05-12 |
| MI | Detroit Juvenile | 445 | 214 | 80 | 294 | 2016-12-12 |
| CT | Hartford Juvenile | 367 | 214 | 60 | 274 | 2016-12-07 |
| IL | Chicago Non-Detained Juveniles | 2,240 | 207 | 109 | 316 | 2018-12-03 |
| TX | Pearsall, Texas — Detention Facility | 2,231 | 207 | 16 | 223 | 2015-11-18 |
| NE | Omaha Juvenile | 633 | 198 | 216 | 414 | 2018-06-21 |
| FL | Florida DOC- Chipley | 64 | 195 | 35 | 230 | 2015-11-10 |
| AZ | Arizona State Prison-Rynning Unit | 56 | 182 | 199 | 381 | 2016-12-13 |
| NJ | Newark Detained DOCket | 503 | 180 | 18 | 198 | 2015-11-03 |
| NV | Las Vegas Juvenile | 428 | 178 | 108 | 286 | 2017-07-06 |
| TX | El Paso Juvenile | 74 | 178 | 28 | 206 | 2015-12-03 |
| NY | Ulster Correctional Facility | 117 | 172 | 41 | 213 | 2015-12-04 |
| OR | Portland — Adults and Children | 900 | 166 | 240 | 406 | 2018-05-10 |
| TX | Southwest Key | 385 | 164 | 24 | 188 | 2016-12-08 |
| NY | New York Service Processing Center (Varick St) | 523 | 157 | 49 | 206 | 2016-03-11 |
| HI | Honolulu, Hawaii | 258 | 145 | 41 | 186 | 2016-01-06 |
| PA | Moshannon Valley Correctional Facility | 55 | 144 | 36 | 180 | 2015-12-14 |
| TX | Houston Service Processing Center | 231 | 126 | 28 | 154 | 2015-12-02 |
| CA | Corrections Corporation of America-San Diego,ca | 516 | 121 | 31 | 152 | 2015-12-14 |
| AZ | Eloy INS Detention Center | 1,387 | 120 | 51 | 171 | 2016-06-13 |
| CA | San Diego Juvenile | 35 | 116 | 39 | 155 | 2016-01-07 |
| CO | Denver Detention Facility | 292 | 114 | 15 | 129 | 2015-10-29 |
| WI | Wisconsin Department of Corrections | 33 | 111 | 73 | 184 | 2016-04-01 |
| CA | Pleasanton — Federal Correctional Institution | 25 | 107 | 35 | 142 | 2015-11-09 |
| OH | Butler County Sheriff's Office | 26 | 105 | 11 | 116 | 2015-09-21 |
| TX | Laredo, Texas — Detention Facility | 43 | 101 | 8 | 109 | 2015-10-02 |
| VA | Arlington Detained Location | 526 | 99 | 26 | 125 | 2016-07-05 |
| MN | Bloomington Juvenile | 340 | 99 | 38 | 137 | 2015-12-16 |
| CA | Imperial Detained | 557 | 97 | 34 | 131 | 2016-03-03 |
| TX | Brownsville, Texas | 29 | 97 | 81 | 178 | 2016-03-04 |
| CA | Adelanto Detention Facility West | 850 | 96 | 29 | 125 | 2016-01-27 |
| IL | Chicago Juvenile | 50 | 93 | 51 | 144 | 2016-04-14 |
| TX | San Antonio Detained Juvenile | 47 | 93 | 20 | 113 | 2015-10-14 |
| TX | El Paso Service Processing Center | 528 | 91 | 19 | 110 | 2015-12-02 |
| TX | T. Don Hutto Residential | 704 | 88 | 12 | 100 | 2015-11-09 |
| MO | Kansas City Immigration Court — Detained | 79 | 88 | 17 | 105 | 2015-10-01 |
| CA | San Francisco Detained | 571 | 84 | 27 | 111 | 2016-01-26 |
| WA | Northwest Detention Center | 1,234 | 81 | 36 | 117 | 2016-01-29 |
| FL | Krome North Service Processing Center | 322 | 78 | 13 | 91 | 2015-12-03 |
| TX | Harlingen, Texas (HJV) | 294 | 78 | 29 | 107 | 2016-01-07 |
| GA | Atlanta Detained Location | 199 | 78 | 25 | 103 | 2016-03-03 |
| AZ | Florence, Arizona | 622 | 74 | 25 | 99 | 2016-01-13 |
| NJ | Elizabeth Detention Center | 157 | 74 | 18 | 92 | 2015-10-29 |
| AZ | Phoenix Juvenile | 56 | 74 | 45 | 119 | 2016-05-06 |
| IL | Chicago Detained | 333 | 65 | 16 | 81 | 2015-10-27 |
| LA | Lasalle Detention Facility | 394 | 62 | 25 | 87 | 2016-01-13 |
| CA | Los Angeles 3 | 208 | 62 | 16 | 78 | 2015-11-10 |
| PA | Philadelphia Adults With Children | 198 | 59 | 116 | 175 | 2016-03-03 |
| NJ | Delaney Hall | 54 | 59 | 13 | 72 | 2015-10-08 |
| PA | Pike County Prison | 29 | 57 | 21 | 78 | 2015-11-03 |
| PA | York County Prison | 321 | 56 | 19 | 75 | 2015-11-16 |
| FL | Broward Transitional Center | 383 | 54 | 25 | 79 | 2015-12-04 |
| LA | DHS-Litigation Unit/Oakdale | 352 | 52 | 29 | 81 | 2016-01-14 |
| UT | Salt Lake City Detained | 104 | 50 | 18 | 68 | 2015-12-16 |
| LA | Federal Corr. Inst.-Oakdale 1 | 56 | 47 | 39 | 86 | 2015-11-18 |
| TX | Joe Corley Detention Facility | 539 | 46 | 15 | 61 | 2015-10-08 |
| NY | Batavia Service Processing Center | 222 | 45 | 14 | 59 | 2015-10-28 |
| TX | Houston Female Detained | 177 | 41 | 17 | 58 | 2015-11-12 |
| MA | Boston Detained | 81 | 41 | 13 | 54 | 2015-10-06 |
| CA | Orange County Detained | 135 | 40 | 18 | 58 | 2015-10-23 |
| TX | Dilley, Texas (Mia) | 639 | 39 | 9 | 48 | 2015-09-15 |
| NE | Omaha Immigration Court — Detained | 79 | 38 | 19 | 57 | 2015-11-06 |
| TX | Johnson County Jail | 79 | 37 | 13 | 50 | 2015-10-01 |
| FL | Immigration Court | 41 | 37 | 12 | 49 | 2015-09-22 |
| MN | Bloomington | 91 | 36 | 10 | 46 | 2015-10-07 |
| TX | Port Isabel Service Processing Center | 233 | 34 | 11 | 45 | 2015-09-28 |
| GA | Stewart Detention Center — Lumpkin Georgia — LGD | 589 | 33 | 21 | 54 | 2015-12-07 |
| TX | Dallas Detained | 52 | 33 | 19 | 52 | 2015-10-22 |
| MI | Detroit Detainees | 48 | 32 | 14 | 46 | 2015-10-15 |
| TX | Rolling Plains Detention Center | 138 | 27 | 9 | 36 | 2015-10-05 |
| CA | Adelanto Detention Facility East | 45 | 21 | 15 | 36 | 2015-09-29 |
| OK | David L. Moss Criminal Justice Center | 55 | 16 | 8 | 24 | 2015-09-15 |
| CA | San Francisco Video | 35 | 15 | 7 | 22 | 2015-09-25 |
| TX | Joe Corley Detained Female | 59 | 5 | 28 | 33 | 2015-10-07 |