Terrorism/National Internal Security
Prosecutions for February 2013Table 1. Criminal Terrorism/National
Internal Security Prosecutions
Number Latest Month 16 Number Previous Month 15 Percent Change from 1 year ago -1.8 Percent Change from 5 years ago -38.9
The latest available data from the Justice Department show that during February 2013 the government reported 16 new terrorism/national internal security prosecutions. According to the case-by-case information analyzed by the Transactional Records Access Clearinghouse (TRAC), this number is up from 15 the previous month.
The comparisons of the number of defendants charged with terrorism/national internal security-related offenses are based on case-by-case information obtained by TRAC under the Freedom of Information Act from the Executive Office for United States Attorneys. See Table 2.
When monthly 2013 prosecutions of this type are compared with those of the same period in the previous year, the number of filings was only slightly down (-1.8 percent). Prosecutions over the past year are still much lower than they were five years ago. Overall, the data show that prosecutions of this type are down 38.9 percent from levels reported in 2008.
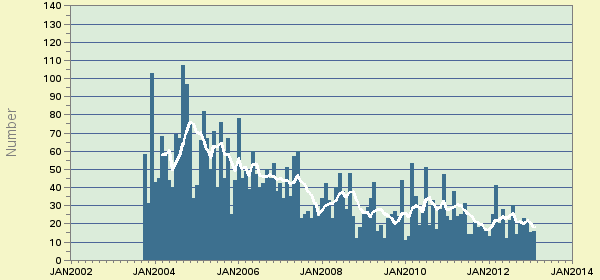
Figure 1. Monthly Trends in Terrorism/National Internal Security ProsecutionsThe decrease from the levels five years ago for terrorism/national internal security prosecutions is shown more clearly in Figure 2. The vertical bars represent the number of prosecutions of this type recorded on a month-to-month basis. Where a prosecution was initially filed in U.S. Magistrate Court and then transferred to the U.S. District Court, the magistrate filing date was used since this provides an earlier indicator of actual trends. The superimposed line on the bars plots the six-month moving average so that natural fluctuations are smoothed out.
Types of Terrorism and National Internal Security Cases
TRAC has previously reported that a decade after 9/11, federal agencies still lack a clear definition of what constitutes a "terrorism" case. While the federal court classification requires that a person be charged with a specific terrorism-related offense, the Justice Department frequently classifies cases as terrorism even when the offense isn't generally identified as such.
Even within different parts of the Justice Department, separate divisions and offices can use quite different definitions. For example, TRAC found that for terrorism cases brought by the National Security Division, only one of four defendants were identified as involved in terrorism cases by the federal prosecutors who actually brought the cases.
Table 2. Terrorism/National Internal Security
Prosecutions Filed by Category, FY 2013*
Program Category Number Percent Total 83 100% Terrorism-Domestic 24 29% Terrorism-Critical Infrastructure
Protection/National Security19 23% Internal Security Offenses 12 14% Terrorism-International 11 13% Terrorism-Related Financing 8 10% Terrorism-Related Hoaxes 6 7% Terrorism-Related Export Enforcement 3 4% *covers the first five months of FY 2013 (Oct 2012 - Feb 2013)All of the statistics shown in this report were compiled from the case-by-case records of federal prosecutors. Within the broad category of terrorism/national internal security, prosecutors also assign cases into more specific types, listed in Table 2. So far this fiscal year — October 2012 through February 2013 — federal prosecutors filed a total of 83 terrorism/national internal security prosecutions. Of these, the single largest number was for domestic terrorism, for which 24 prosecutions have been filed. In contrast, international terrorism prosecutions have been much less frequent, with only 11 prosecutions filed so far this year.
Following domestic terrorism, the second largest number of prosecutions fell under the program area focused on protecting the country's critical infrastructure, for which 19 prosecutions have been filed. The third largest category, with 12 prosecutions, was for crimes classified as "internal security offenses." This category covers a wide range of offenses, from treason and espionage to violations of the Foreign Agents Registration Act of 1938 and the Military Selective Service Act.
The FBI was the lead investigative agency in three out of four (73%) of these cases. For the remainder, a variety of other agencies played the lead role. See Table 3.
Table 3. Terrorism/National Internal Security Prosecutions Filed by Agency, FY 2013*
Lead Investigative Agency Number Percent Total 83 100% Justice - Federal Bureau of Investigation 61 73% Justice - Alcohol, Tobacco, Firearms, and Explosives 4 5% Homeland Security - Immigration and Customs Enforcement 3 4% Justice - Drug Enforcement Administration 3 4% Postal Service 2 2% State Department 2 2% All Other Independent Agencies 2 2% Commerce 1 1% Homeland Security - Citizen and Immigration Services 1 1% Homeland Security - Other 1 1% Justice - US Marshals Service 1 1% Treasury 1 1% State/Local Authorities 1 1% * covers the first five months of FY 2013 (Oct 2012 - Feb 2013)Where Recent Prosecutions Took Place
The Central District of California (Los Angeles) led the nation with the largest number of defendants prosecuted for terrorism/internal security offenses so far this year — a total of 12. Three other districts were tied for second place, each with six cases: the Eastern District of Louisiana (New Orleans), the Eastern District of New York (Brooklyn) and the Western District of Tennessee (Memphis). But a surprisingly large number of additional federal districts from all regions of the country have had at least one prosecution this year; see Table 4.
Table 4. Terrorism/National Internal Security Prosecutions Filed by District, FY 2013*
Federal District Number Percent Total 83 100% Cal, C 12 14% La, E 6 7% N. Y., E 6 7% Tenn, W 6 7% Virg, E 5 6% Fla, S 4 5% N. J. 3 4% Ala, S 2 2% Arizona 2 2% Conn 2 2% D. C. 2 2% Ind, S 2 2% N Car, W 2 2% Ohio, N 2 2% S Car 2 2% Texas, N 2 2% Cal, E 1 1% Cal, S 1 1% Fla, M 1 1% Ill, N 1 1% La, M 1 1% Mass 1 1% Mich, E 1 1% Miss, N 1 1% N. Y., N 1 1% N. Y., W 1 1% Nebraska 1 1% Nevada 1 1% Okla, N 1 1% Okla, W 1 1% Oregon 1 1% Penn, E 1 1% Penn, W 1 1% S Dakota 1 1% Texas, S 1 1% Wash, E 1 1% Wash, W 1 1% Wisc, W 1 1% Guam 1 1% * covers the first five months of FY 2013 (Oct 2012 - Feb 2013)Report Generated: April 23, 2013
