Terrorism-Domestic Prosecutions for 2020
Number Year-to-date 183 Percent Change from previous year 103 Percent Change from 5 years ago 195 Percent Change from 10 years ago 48.8 Percent Change from 20 years ago 281
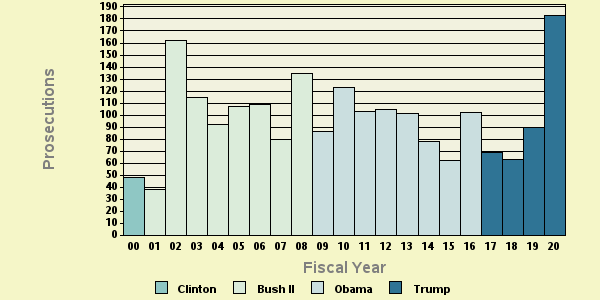
Table 1: Criminal Terrorism-Domestic ProsecutionsThe latest available data from the Justice Department show that during FY 2020 the government reported 183 new terrorism-domestic prosecutions. According to the case-by-case information analyzed by the Transactional Records Access Clearinghouse (TRAC), this number is up 103% over the past fiscal year when the number of prosecutions totaled 90.
The comparisons of the number of defendants charged with terrorism-domestic-r offenses are based on case-by-case information obtained by TRAC under the Freedom of Information Act from the Executive Office for United States Attorneys (see Table 1).
Compared to five years ago when there were 62, the number of FY 2020 prosecutions of this type is up 195 percent. Prosecutions over the past year are higher than they were ten years ago. Overall, the data show that prosecutions of this type are up 48.8 percent from the level of 123 reported in 2010 and up 281 percent from the level of 48 reported in 2000.
The long term trend in terrorism-domestic prosecutions for these matters going back to FY 2000 is shown more clearly in Figure 1. The vertical bars in Figure 1 represent the number of terrorism-domestic prosecutions of this type recorded each fiscal year. Each presidential administration is distinguished by the color of the bars. To view trends month-by-month rather than year-by-year, see TRAC's monthly report series for the latest data.
Leading Investigative Agencies
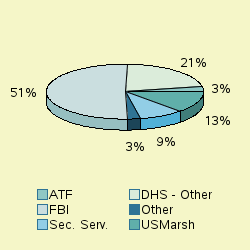
The lead investigative agency for terrorism-domestic prosecutions through September 2020 was "Justice - Federal Bureau of Investigation" accounting for 50.8 percent of prosecutions referred.
As shown in Figure 2, additional agencies with substantial numbers of terrorism-domestic referrals were: Homeland Security - Other (21.3%), "Justice - US Marshals Service" (12.6%), "Homeland Security - Secret Service (formerly Treasury)" (9.3%), "Justice - Alcohol, Tobacco, Firearms, and Explosives (formerly Treasury)" (3.3%).
Top Ranked Lead Charges
Table 2 shows the top lead charges recorded in the prosecutions of terrorism-domestic matters filed in U.S. District Court during FY 2020.
Lead Charge Count Rank 1 yr ago 5 yrs ago 10 yrs ago 20 yrs ago 18 USC 111 - Assaulting, resisting, impeding certain officers 39 1 27 5 7 15 More 18 USC 875 - Interstate Communications 30 2 2 1 5 3 More 18 USC 844 - Explosives - Importation and storage of explosives 23 3 4 2 2 1 More Federal Regulation 21 4 - - - - More 18 USC 231 - Civil Disorders 17 5 27 27 37 15 More Other US Code Section 12 6 1 6 37 15 More 18 USC 401 - Power of Court 5 7 - - - - More 18 USC 871 - Threats against President and successors 4 8 7 9 6 3 More 18 USC 922 - Firearms; Unlawful acts 4 8 7 2 9 9 More 18 USC 175 - Prohibitions with respect to biological weapons 3 10 13 9 37 15 More 18 USC 245 - Federally protected activities 3 10 27 27 37 - More 18 USC 371 - Conspiracy to commit offense or to defraud US 3 10 13 14 9 7 More 18 USC 876 - Mailing threatening communications 3 10 3 6 9 3 More
Table 2: Top charges filed
"Assaulting, resisting, impeding certain officers" (Title 18 U.S.C Section 111) was the most frequent recorded lead charge. It was ranked 7th ten years ago and 15th twenty years ago.
Ranked 2nd in frequency was the lead charge "Interstate Communications" under Title 18 U.S.C Section 875. Title 18 U.S.C Section 875 was ranked 2nd a year ago, while it was the 1st most frequently invoked five years ago. It was ranked 5th ten years ago and 3rd twenty years ago.
Ranked 3rd was "Explosives - Importation and storage of explosives" under Title 18 U.S.C Section 844. Title 18 U.S.C Section 844 was ranked 4th a year ago, while it was the 2nd most frequently invoked five years ago. It was ranked 2nd ten years ago and 1st twenty years ago.
Again among the top ten lead charges, the one showing the sharpest decline in prosecutions compared to one year ago—down -57 percent—was "Mailing threatening communications " (Title 18 U.S.C Section 876 ). This was the same statute that had the largest decrease—-33%—when compared with five years ago.
Top Ranked Judicial Districts
During FY 2019 the Justice Department said the government obtained 0.3 terrorism-domestic prosecutions for every one million people in the United States. Terrorism-Domestic prosecutions for one million people in the United States during FY 2020 were 0.6 . Understandably, there is great variation in the per capita number of terrorism-domestic prosecutions in each of the nation's ninety-four federal judicial districts
Judicial District Percapita Count Rank 1yr ago 5yrs ago 10yrs ago 20yrs ago D. C. 23 16 1 1 1 39 - More Oregon 18 78 2 46 28 30 - More N Dakota 4 3 3 46 - 6 22 More La, M 4 3 4 46 - 39 - More Ark, E 2 3 5 6 37 - 22 More Vermont 2 1 6 46 - 39 22 More Utah 2 5 7 30 37 7 22 More Maine 1 2 8 3 - - - More Alaska 1 1 9 8 37 39 - More W Virg, S 1 1 10 46 - 39 - More
Table 3: Top 10 districts (per one million people)
The District of Washington, D.C. (Washington)—with 22.67 prosecutions as compared with 0.6 prosecutions per one million people in the United States—was the most active through September 2020. The District of Washington, D.C. (Washington) was ranked 1st a year ago as well as five years ago. The district's position ten years ago was 39th.
The District of Oregon ranked 2nd.
The District of North Dakota now ranks 3rd.
Recent entries to the top 10 list were Utah, Oregon, North Dakota, Middle District of Louisiana (Baton Rouge), Vermont and Southern District of West Virginia (Charleston), now ranked 7th, 2nd, 3rd, 4th, 6th and 10th. These districts ranked 30th, 46th, 46th, 46th, 46th and 46th one year ago and 37th, 28th, unranked, unranked, unranked and . five years ago.
Compared to 10 years ago, Oregon, Washington, D.C. (Washington), Middle District of Louisiana (Baton Rouge), Vermont, Alaska and Southern District of West Virginia (Charleston) now ranked in the top 10 did not appear in the top ten.
And compared to 20 years ago, North Dakota, Eastern District of Arkansas (Little Rock), Vermont and Utah were not sufficiently active to then make the top 10.
The federal judicial district which showed the greatest growth in the rate of terrorism-domestic prosecutions compared to one year ago—403 percent—was Utah. Compared to five years ago, the district with the largest growth—7297 percent—was Oregon .
In the last year, the judicial District Court recording the largest drop in the rate of terrorism-domestic prosecutions—33.3 percent—was Maine.
Report Generated: January 9, 2021