National Internal Security/Terrorism Prosecutions for 2020
Number Year-to-date 301 Percent Change from previous year 19.4 Percent Change from 5 years ago 36.8 Percent Change from 10 years ago -17.5 Percent Change from 20 years ago 301
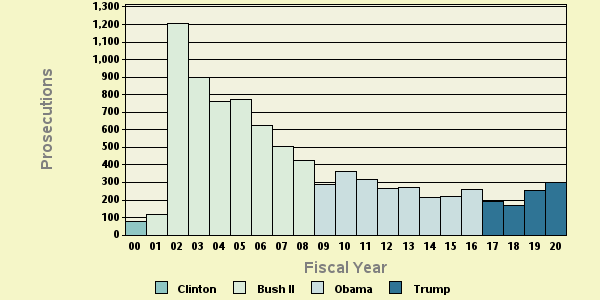
Table 1: Criminal National Internal Security/Terrorism ProsecutionsThe latest available data from the Justice Department show that during FY 2020 the government reported 301 new national internal security/terrorism prosecutions. According to the case-by-case information analyzed by the Transactional Records Access Clearinghouse (TRAC), this number is up 19.4% over the past fiscal year when the number of prosecutions totaled 252.
The comparisons of the number of defendants charged with national internal se offenses are based on case-by-case information obtained by TRAC under the Freedom of Information Act from the Executive Office for United States Attorneys (see Table 1).
Compared to five years ago when there were 220, the number of FY 2020 prosecutions of this type is up 36.8 percent. Prosecutions over the past year are still lower than they were ten years ago. Overall, the data show that prosecutions of this type are down 17.5 percent from the level of 365 reported in 2010 but up 301 percent from the level of 75 reported in 2000.
The long term trend in national internal security/terrorism prosecutions for these matters going back to FY 2000 is shown more clearly in Figure 1. The vertical bars in Figure 1 represent the number of national internal security/terrorism prosecutions of this type recorded each fiscal year. Each presidential administration is distinguished by the color of the bars. To view trends month-by-month rather than year-by-year, see TRAC's monthly report series for the latest data.
Leading Program Categories
Within the broad category of national internal security/terrorism, cases were classified by prosecutors into more specific types.
Case types within national internal security/terrorism are
Internal Security Offenses
Terrorism (Anti)-All Others
Terrorism (Anti)-Environmental
Terrorism (Anti)-Identity Theft
Terrorism (Anti)-Immigration
Terrorism (Anti)-Non-OCTETF Drugs
Terrorism (Anti)-OCDETF Drugs
Terrorism (Anti)-Violent Crimes
Terrorism-Critical Infrastructure Protection/National Security
Terrorism-Domestic
Terrorism-International
Terrorism-Related Export Enforcement
Terrorism-Related Financing
Terrorism-Related Hoaxes
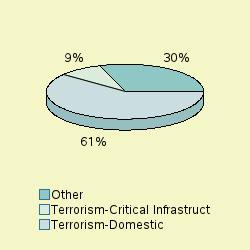
The single largest number of prosecutions of these matters through September 2020 was for "Terrorism-Domestic", accounting for 60.8 percent of prosecutions.
As shown in Figure 2, the second largest number of matters were prosecutions filed under the program area of "Terrorism-Critical Infrastructure Protection/National Security " (9%) . The "Other" category in Figure 2 is comprised of a diverse group of programs. The largest specific programs within the "Other" category were: Internal Security Offenses" (8.3%), "Terrorism-International" (7%), "Terrorism-Related Hoaxes" (6%), "Terrorism-Related Export Enforcement" (2.7%), "Terrorism-National Cyber Security" (2.3%). See Figure 2.
Leading Investigative Agencies
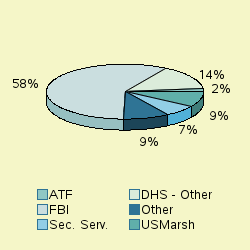
The lead investigative agency for national internal security/terrorism prosecutions through September 2020 was "Justice - Federal Bureau of Investigation" accounting for 58.5 percent of prosecutions referred.
As shown in Figure 3, additional agencies with substantial numbers of national internal security/terrorism referrals were: Homeland Security - Other (14.3%), "Justice - US Marshals Service" (9%), "Homeland Security - Secret Service (formerly Treasury)" (7%).
Top Ranked Lead Charges
Table 2 shows the top lead charges recorded in the prosecutions of national internal security/terrorism matters filed in U.S. District Court during FY 2020.
Lead Charge Count Rank 1 yr ago 5 yrs ago 10 yrs ago 20 yrs ago 18 USC 111 - Assaulting, resisting, impeding certain officers 40 1 31 8 28 26 More 18 USC 875 - Interstate Communications 34 2 3 6 12 5 More Other US Code Section 28 3 1 4 21 7 More 18 USC 844 - Explosives - Importation and storage of explosives 26 4 4 3 1 1 More Federal Regulation 22 5 - - 49 - More 18 USC 231 - Civil Disorders 18 6 58 55 76 26 More 18 USC 2339B - Provide material support to foreign terrorist orgs 15 7 2 1 3 26 More 18 USC 1038 - False Information and Hoaxes 11 8 6 2 3 - More 18 USC 2339 - Harboring or Concealing Terrorists 7 9 7 4 12 26 More 18 USC 371 - Conspiracy to commit offense or to defraud US 6 10 4 19 2 11 More 18 USC 922 - Firearms; Unlawful acts 6 10 9 7 17 7 More
Table 2: Top charges filed
"Assaulting, resisting, impeding certain officers" (Title 18 U.S.C Section 111) was the most frequent recorded lead charge. It was ranked 28th ten years ago and 26th twenty years ago.
Ranked 2nd in frequency was the lead charge "Interstate Communications" under Title 18 U.S.C Section 875. Title 18 U.S.C Section 875 was ranked 3rd a year ago, while it was the 6th most frequently invoked five years ago. It was ranked 12th ten years ago and 5th twenty years ago.
Ranked 3rd was "Other US Code Section" under Title U.S.C Section. Title U.S.C Section was ranked 1st a year ago, while it was the 4th most frequently invoked five years ago. It was ranked 21st ten years ago and 7th twenty years ago.
Again among the top ten lead charges, the one showing the sharpest decline in prosecutions compared to one year ago—down -60 percent—was "Conspiracy to commit offense or to defraud US " (Title 18 U.S.C Section 371 ). This was the same statute that had the largest decrease—-53%—when compared with five years ago.
Top Ranked Judicial Districts
During FY 2019 the Justice Department said the government obtained 0.8 national internal security/terrorism prosecutions for every one million people in the United States. National Internal Security/Terrorism prosecutions for one million people in the United States during FY 2020 were 0.9 . Understandably, there is great variation in the per capita number of national internal security/terrorism prosecutions in each of the nation's ninety-four federal judicial districts
Judicial District Percapita Count Rank 1yr ago 5yrs ago 10yrs ago 20yrs ago D. C. 33 23 1 1 1 1 1 More Oregon 19 82 2 65 44 40 30 More N Dakota 5 4 3 65 18 9 30 More La, M 4 3 4 65 6 66 - More Tenn, W 3 5 5 2 2 13 30 More Utah 2 7 6 41 36 20 30 More W Virg, N 2 2 7 10 7 66 30 More Ark, E 2 3 8 16 63 - 30 More Vermont 2 1 9 20 63 66 30 More N. Y., S 2 8 10 13 17 11 4 More
Table 3: Top 10 districts (per one million people)
The District of Washington, D.C. (Washington)—with 32.59 prosecutions as compared with 0.9 prosecutions per one million people in the United States—was the most active through September 2020. The District of Washington, D.C. (Washington) was ranked 1st a year ago as well as five years ago. The district's position ten years ago was 1st as well as twenty years ago.
The District of Oregon ranked 2nd.
The District of North Dakota now ranks 3rd.
Recent entries to the top 10 list were Southern District of New York (Manhattan), Eastern District of Arkansas (Little Rock), Vermont, Utah, Oregon, North Dakota and Middle District of Louisiana (Baton Rouge), now ranked 10th, 8th, 9th, 6th, 2nd, 3rd and 4th. These districts ranked 13th, 16th, 20th, 41st, 65th, 65th and 65th one year ago and 17th, 63rd, 63rd, 36th, 44th, 18th and 6th five years ago.
Compared to 10 years ago, Southern District of New York (Manhattan), Western District of Tennessee (Memphis), Utah, Oregon, Middle District of Louisiana (Baton Rouge), Northern District of West Virginia (Wheeling) and Vermont now ranked in the top 10 did not appear in the top ten.
And compared to 20 years ago, Oregon, North Dakota, Western District of Tennessee (Memphis), Utah, Northern District of West Virginia (Wheeling), Eastern District of Arkansas (Little Rock) and Vermont were not sufficiently active to then make the top 10.
The federal judicial district which showed the greatest growth in the rate of national internal security/terrorism prosecutions compared to one year ago—252 percent—was Utah. Compared to five years ago, the district with the largest growth—3788 percent—was Oregon .
In the last year, the judicial District Court recording the largest drop in the rate of national internal security/terrorism prosecutions—28.6 percent—was Western District of Tennessee (Memphis).
Report Generated: January 9, 2021