Federal Weapons Prosecutions Continue to Climb in 2019
| Number Year-to-date | 6,526 |
|---|---|
| Percent Change from previous year | 11.2 |
| Percent Change from 5 years ago | 68.7 |
| Percent Change from 10 years ago | 36.6 |
| Percent Change from 20 years ago | 126 |
The latest available data from the Justice Department show that during the first seven months of FY 2019 the government reported 6,526 new weapons prosecutions. If this activity continues at the same pace, the annual total of prosecutions will be 11,187 for this fiscal year. According to the case-by-case information analyzed by the Transactional Records Access Clearinghouse (TRAC), this estimate is up 11.2% over the past fiscal year when the number of prosecutions totaled 10,058.
The comparisons of the number of defendants charged with weapons-related offenses are based on case-by-case information obtained by TRAC under the Freedom of Information Act from the Executive Office for United States Attorneys (see Table 1).
Compared to five years ago when there were 6,632, the estimate of FY 2019 prosecutions of this type is up 68.7 percent. Prosecutions over the past year are higher than they were ten years ago. Overall, the data show that prosecutions of this type are up 36.6 percent from the level of 8,188 reported in 2009 and up 126 percent from the level of 4,948 reported in 1999.

The long term trend in weapons prosecutions for these matters going back to FY 1999 is shown more clearly in Figure 1. The vertical bars in Figure 1 represent the number of weapons prosecutions of this type recorded each fiscal year. Projected figures for the current fiscal year are shown. Each presidential administration is distinguished by the color of the bars.
Leading Investigative Agencies
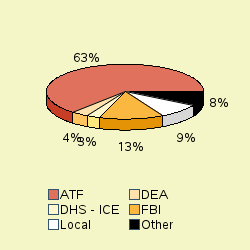
The lead investigative agency for weapons prosecutions through April 2019 was Alcohol, Tobacco, Firearms, and Explosives (ATF) accounting for 63.5 percent of prosecutions referred.
As shown in Figure 2, additional agencies with substantial numbers of weapons referrals were: the Federal Bureau of Investigation (13.2%), referrals from state and local authorities" (8.9%), the Drug Enforcement Administration (3.6%), and Immigration and Customs Enforcement (2.7%).
Top Ranked Lead Charges
Table 2 shows the top lead charges recorded in the prosecutions of weapons matters filed in U.S. District Court during the first seven months of FY 2019. Two out of every three were for the offense of unlawful shipment, transfer, receipt, or possession of a firearm by a felon.
| Lead Charge | Number |
|---|---|
| Total | 6,526 |
| 18 :00924c1A - Use or carry a dangerous weapon in drug crime or crime of violence | 74 |
| 18 :00924c1C - Use/carry of firearm during crime of violence/drug trafficking offense | 121 |
| 18 USC 1951 - Hobbs Act | 171 |
| 18 USC 1951a - Obstruct,delay,affect commerce or movement of any article in commerce | 44 |
| 18 USC 2119 - Carjacking | 49 |
| 18 USC 371 - Conspiracy to commit offense or to defraud US | 30 |
| 18 USC 554 - Smuggling goods from the United States | 74 |
| 18 USC 922a1A - Unlawfully engaging in the business of firearms | 56 |
| 18 USC 922a6 - False/Fictitious statements in order to acquire a firearm/ammunition | 167 |
| 18 USC 922g1 - Unlawful shipment, transfer, receipt, or possesion by a felon | 4,379 |
| 18 USC 922g3 - Unlawful shipment, transfer, receipt, or possession by a drug addict | 90 |
| 18 USC 922g5A - Unlawful possession by an Alien unlawfully in the United States | 110 |
| 18 USC 922g5B - Unlawful possession by Alien admitted to U.S. under non-immigrant visa | 25 |
| 18 USC 922g9 - Unlaw possession by person convicted of misdemeanor domestic violence | 137 |
| 18 USC 922j - Receipt or possession of a stolen firearm and ammunition | 72 |
| 18 USC 922n - Unlawful transportation or receipt by a person under felony indictment | 38 |
| 18 USC 922u - Theft from a licensee inventory | 26 |
| 18 USC 924a1A - False Firearm Records | 71 |
| 18 USC 924c1Ai - Use/carry/possess firearm during commission federal crime of violence | 75 |
| 18 USC 924c1Aii - Brandishing a firearm during commission of a federal crime of violence | 32 |
| 21 USC 841a1 - Manufacture, distribute, dispense, possess a controlled substance | 133 |
| 21 USC 846 - Attempt and conspiracy | 105 |
| 26 USC 5861d - Receive/possess firearm not register in National Firearm Registration | 63 |
| All other lead charges with < 25 individuals charged | 384 |
Top Ranked Judicial Districts
During FY 2018 the Justice Department said the government obtained 30.9 weapons prosecutions for every one million people in the United States. If pace during the first seven months of FY 2019 continues at the same rate, weapons prosecutions for one million people in the United States this year will be 34.3. Understandably, there is great variation in the per capita number of weapons prosecutions in each of the nation's ninety-four federal judicial districts.
| Judicial District | Percapita | Count | Rank | 1yr ago | 5yrs ago | 10yrs ago | 20yrs ago |
|---|---|---|---|---|---|---|---|
| Mo, E | 236 | 403 | 1 | 1 | 9 | 2 | 17 |
| D. C. | 200 | 81 | 2 | 10 | 20 | 79 | 1 |
| Ark, E | 149 | 143 | 3 | 4 | 33 | 26 | 46 |
| Ala, S | 130 | 64 | 4 | 2 | 1 | 5 | 14 |
| Tenn, W | 122 | 112 | 5 | 3 | 2 | 1 | 20 |
| Mo, W | 120 | 223 | 6 | 7 | 5 | 13 | 22 |
| Iowa, N | 119 | 92 | 7 | 5 | 13 | 32 | 33 |
| Okla, N | 108 | 67 | 8 | 12 | 39 | 12 | 41 |
| Ga, S | 93 | 86 | 9 | 20 | 23 | 4 | 50 |
| Alaska | 91 | 38 | 10 | 8 | 34 | 21 | 64 |
The Eastern District of Missouri (St. Louis) ranked first with the most weapons prosecutions filed (403) and a rate relative to its population size of almost seven times (6.9) the national average. It was also ranked most active (relative to its population) during FY 2018 as well.
On a per capita basis, Washington, D.C. ranked second with 5.8 times the national average. It had 81 prosecutions. Last year the district had ranked tenth. Twenty years ago it was ranked most active of all districts relative to its population size.
The Eastern District of Arkansas (Little Rock) was the third most active in the country relative to its population size, with a rate 4.3 times the national average. It also was active during FY 2018 where it ranked fourth.
The Western District of Missouri (Kansas City) also made the top ten with the third largest number of weapons prosecutions, and the sixth highest rate relative to its population size.
Other district within the top ten ranked most active relative to their population size included: the Southern District of Alabama (Mobile), the Western District of Tennessee (Memphis), the Northern District of Iowa (Cedar Rapids), the Northern District of Oklahoma (Tulsa), the Southern District of Georgia (Savannah), and Alaska.
TRAC offers free monthly reports on program categories such as white collar crime, immigration, drugs, weapons and terrorism and on selected government agencies such as the IRS, FBI, ATF and DHS. For the latest information on prosecutions and convictions, go to http://trac.syr.edu/tracreports/bulletins/. In addition, subscribers to the TRACFed data service can generate custom reports for a specific agency, judicial district, program category, lead charge or judge via the TRAC Data Interpreter.