White Collar Prosecutions Hit All-Time Low in January 2019
| Number Latest Month | 337 |
|---|---|
| Percent Change from previous month | -20.3 |
| Percent Change from 1 year ago | -5.3 |
| Percent Change from 5 years ago
(Including Magistrate Court) |
-35.7 |
The latest available data from the Justice Department show that during January 2019 the government reported 337 new white collar crime prosecutions. This is an historic low since monthly tracking began in October 1998. According to the case-by-case information analyzed by the Transactional Records Access Clearinghouse (TRAC) at Syracuse University, this number is down 20.3 percent over the previous month, and continues a five-month downward slide.
Compared to five years ago, January filings were down 35.7 percent. White-collar prosecutions since President Trump assumed office generally have been lower than in previous administrations. The comparisons of the number of defendants charged with white collar crime-related offenses are based on case-by-case information obtained by TRAC under the Freedom of Information Act from the Executive Office for United States Attorneys (see Table 1).
The decrease from the levels five years ago in white collar crime prosecutions for these matters is shown more clearly in Figure 1. The vertical bars in Figure 1 represent the number of white collar crime prosecutions recorded by federal prosecutors on a month-to-month basis. Where a prosecution was initially filed in U.S. Magistrate Court and then transferred to the U.S. District Court, the magistrate filing date was used since this provides an earlier indicator of actual trends. The superimposed line on the bars plots the six-month moving average so that natural fluctuations are smoothed out. The one and five-year rates of change in Table 1 and in the sections that follow are all based upon this six-month moving average.

Within the broad category of white collar crime, cases were classified by prosecutors into more specific types.
Case types within white collar crime are
| • | Federal Procurement Fraud | • | Federal Program Fraud |
| • | Tax Fraud | • | Arson for Profit |
| • | Other Insurance Fraud | • | Financial Institution Fraud |
| • | Bankruptcy Fraud | • | Advance Fee Schemes |
| • | Other Fraud Against Businesses | • | Consumer Fraud |
| • | Securities Fraud | • | Commodities Fraud |
| • | Other Investment Fraud | • | Antitrust Violations - Other |
| • | Computer Fraud | • | Health Care Fraud |
| • | Fraud Against Insurance Providers | • | Intellectual Property Violations |
| • | Insider Fraud Against Insurance Providers | • | MEWA (Multiple Employer Welfare Arrangements) Fraud/MET |
| • | Antitrust Violations - Airlines | • | Antitrust Violations - Banking |
| • | Antitrust Violations - Defense Procurement | • | Antitrust Violations - Extraterritorial Application Of |
| • | Antitrust Violations - Finance Markets, Other than Banking | • | Telemarketing Fraud |
| • | Corporate Fraud | • | Identity Theft |
| • | Aggravated Identity Theft | • | Other White Collar Crime/Fraud |
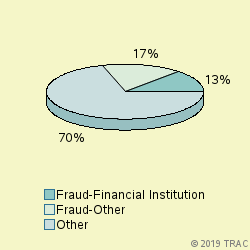
The largest number of prosecutions of these matters in January 2019 was for "Fraud-Other", accounting for 16.6 percent of prosecutions. Prosecutions were also filed for "Fraud-Financial Institution" (13.1%), "Fraud-Identity Theft-Aggravated" (12.2%), "Fraud-Tax" (11.9%), "Fraud-Identity Theft-Other" (10.1%), "Fraud-Federal Program" (9.5%), "Fraud-Health Care" (6.2%), "Fraud-Computer" (5.3%), "Fraud-Other Business" (4.7%), "Fraud-Consumer" (2.1%), "Fraud-Corporate" (2.1%). See Figure 2.
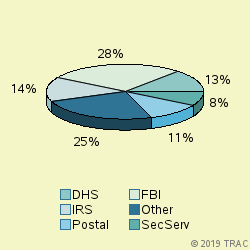
The lead investigative agency for white collar crime prosecutions in January 2019 was FBI accounting for 28 percent of prosecutions referred. Other agencies with substantial numbers of white collar crime referrals were: IRS (14% ), DHS (13%), Postal (11%), SecServ (8%). See Figure 3.
White Collar Crime Prosecutions in U.S. Magistrate Courts
Top Ranked Lead Charges
In January 2019, 42 defendants in white collar crime cases for these matters were filed in U.S. Magistrate Courts. These courts handle less serious misdemeanor cases, including what are called "petty offenses." In addition, complaints are sometimes filed in the magistrate courts before an indictment or information is entered. In these cases, the matter starts in the magistrate courts and later moves to the district court where subsequent proceedings take place.
In the magistrate courts in January the most frequently cited lead charge was Title 18 U.S.C Section 1028 involving "Aggravated Identity Theft". This was the lead charge for 26.2 percent of all magistrate filings in January.
Other frequently prosecuted lead charges include: "18 USC 1349 - Mail Fraud - Attempt and Conspiracy" (16.7%), "18 USC 1029 - Fraud and related activity - access devices" (11.9%).
White Collar Crime Prosecutions in U.S. District Courts
In January 2019, 295 defendants in new cases for these matters were charged in the U.S. District Courts. In addition during January there were an additional 41 defendants whose cases moved from the magistrate courts to the U.S. district courts after an indictment or information was filed. The sections which follow cover both sets of cases and therefore cover all matters filed in district court during January.
Top Ranked Lead Charges
Table 2 shows the top lead charges recorded in the prosecutions of white collar crime matters filed in U.S. District Court during January 2019.
| Lead Charge | Count | Rank | 1yr ago | 5yrs ago |
|---|---|---|---|---|
| 18 USC 1343 - Fraud by wire, radio, or television | 54 | 1 | 1 | 1 |
| 18 USC 1344 - Bank Fraud | 34 | 2 | 2 | 3 |
| 18 USC 371 - Conspiracy to commit offense or to defraud US | 28 | 3 | 5 | 5 |
| 18 USC 1029 - Fraud and related activity - access devices | 26 | 4 | 3 | 7 |
| 18 USC 1349 - Mail Fraud - Attempt and Conspiracy | 21 | 5 | 4 | 2 |
| 18 USC 1028 - Fraud and related activity - id documents | 17 | 6 | 9 | 8 |
| 18 USC 641 - Public money, property or records | 16 | 7 | 6 | 4 |
| 18 USC 1347 - Health Care Fraud | 16 | 7 | 8 | 9 |
| 18 USC 1341 - Mail Fraud - Frauds and swindles | 14 | 9 | 7 | 6 |
| 26 USC 7201 - Attempt to evade or defeat tax | 14 | 9 | 11 | 10 |
-
"Fraud by wire, radio, or television" (Title 18 U.S.C Section 1343) was the most frequent recorded lead charge. "Fraud by wire, radio, or television" (Title 18 U.S.C Section 1343) was ranked 1 a year ago, while it was ranked 1 five years ago.
-
Ranked 2nd in frequency was the lead charge "Bank Fraud" under Title 18 U.S.C Section 1344. "Bank Fraud" under Title 18 U.S.C Section 1344 was ranked 2 a year ago, while it was ranked 3 five years ago.
-
Ranked 3rd was "Conspiracy to commit offense or to defraud US" under Title 18 U.S.C Section 371. "Conspiracy to commit offense or to defraud US" under Title 18 U.S.C Section 371 was ranked 5 a year ago, while it was ranked 5 five years ago.
Among these top ten lead charges, the one showing the greatest increase in prosecutions — up 32 percent — compared to one year ago was Title 18 U.S.C Section 641 that involves " Public money, property or records".
Again among the top ten lead charges, the one showing the sharpest decline in prosecutions compared to one year ago — down 31.2 percent — was " Conspiracy to commit offense or to defraud US " (Title 18 U.S.C Section 371 ). Compared to five years ago, the most significant decline in prosecutions — 58.4 percent — was for filings where the lead charge was " Mail Fraud - Frauds and swindles " (Title 18 U.S.C Section 1341 ).
Top Ranked Judicial Districts
In January 2019 the Justice Department's case-by-case records show that the government brought 123.8 white collar crime prosecutions for every ten million people in the United States.
Understandably, there is great variation in the per capita number of white collar crime prosecutions that are filed in each of the nation's ninety-four federal judicial districts.
The districts registering the largest number of prosecutions per capita for these matters in January are shown in Table 3. Districts must have at least 5 white collar crime prosecutions to receive a ranking.
| Judicial District | Percapita | Count | Rank | 1yr ago | 5yrs ago |
|---|---|---|---|---|---|
| Ill, S | 954 | 10 | 1 | 51 | 30 |
| N. Y., S | 408 | 18 | 2 | 2 | 3 |
| Penn, E | 407 | 20 | 3 | 9 | 9 |
| Nebraska | 375 | 6 | 4 | 38 | 47 |
| Virg, W | 329 | 6 | 5 | 76 | 60 |
| Conn | 268 | 8 | 6 | 30 | 48 |
| Wash, W | 228 | 11 | 7 | 27 | 35 |
| Penn, W | 225 | 7 | 8 | 17 | 39 |
| Mass | 192 | 11 | 9 | 19 | 37 |
| S Car | 191 | 8 | 10 | 3 | 12 |
-
The Southern District of Illinois (East St. Louis) — with 954 prosecutions as compared with 123.8 prosecutions per ten million population in the United States — was the most active during January 2019.
-
The Southern District of New York (Manhattan) ranked 2nd. The Southern District of New York (Manhattan) was ranked 2 a year ago, while it was ranked 3 for most frequent use five years ago.
-
Eastern District of Pennsylvania (Philadelphia) is now ranking 3rd. The Eastern District of Pennsylvania (Philadelphia) was ranked 9 a year ago, while it was ranked 9 for most frequent use five years ago.
Recent entrants to the top 10 list were Western District of Pennsylvania (Pittsburgh), now ranked 8 th , and Massachusetts at 9th In the same order, these districts ranked 17th and 19th one year ago and 39th and 37th five years ago.
The federal judicial district which showed the greatest growth in the rate of white collar crime prosecutions compared to one year ago — 105.6 percent — was Massachusetts. This was the same district that had the largest increase — 100 percent — when compared with five years ago.
In the last year, the judicial District Court recording the largest drop in the rate of white collar crime prosecutions — 41.7 percent — was South Carolina. But over the past five years, Southern District of Illinois (East St. Louis) showed the largest drop — 54.5 percent.
Top Ranked District Judges
At any one time, there are about 680 federal District Court judges working in the United States. The judges recorded with the largest number of new white collar crime crime cases of this type during January 2019 are shown in Table 4.
| Judge | Count | Rank | |
|---|---|---|---|
| Schmehl, Jeffrey L. | Penn, E | 9 | 1 |
| Yandle, Staci Michelle | Ill, S | 8 | 2 |
| Jones, James Parker | Virg, W | 5 | 3 |
| Sheridan, Peter G. | N. J. | 4 | 4 |
| Feuerstein, Sandra J. | N. Y., E | 4 | 4 |
| Leeson, Joseph F., Jr. | Penn, E | 4 | 4 |
| Lasnik, Robert S. | Wash, W | 4 | 4 |
| Drozd, Dale A. | Cal, E | 3 | 8 |
| Norgle, Charles Ronald, Sr. | Ill, N | 3 | 8 |
| Magnus-Stinson, Jane Elizabeth | Ind, S | 3 | 8 |
| Burroughs, Allison Dale | Mass | 3 | 8 |
| Cogburn, Max Oliver, Jr. | N Car, W | 3 | 8 |
| Smith Camp, Laurie Smith | Nebraska | 3 | 8 |
| Rose, Thomas M. | Ohio, S | 3 | 8 |
| Schwab, Arthur J. | Penn, W | 3 | 8 |
| Boyle, Jane J. | Texas, N | 3 | 8 |
| Martinez, Ricardo S. | Wash, W | 3 | 8 |
| Pepper, Pamela | Wisc, E | 3 | 8 |
A total of 9 out of the "top ten" judges were in districts which were in the top ten with the largest number of white collar crime filings per capita, while the remaining 9 judges were from other districts. (Because of ties, there were a total of 18 judges in the "top ten" rankings.)
-
Judge Jeffrey L. Schmehl in the Eastern District of Pennsylvania (Philadelphia) ranked 1st with 9 defendants in white collar crime cases.
-
Judge Staci Michelle Yandle in the Southern District of Illinois (East St. Louis) ranked 2nd with 8 defendants in white collar crime cases.
-
Judge James Parker Jones in the Western District of Virginia (Roanoke) ranked 3rd with 5 defendants in white collar crime cases.
TRAC offers free monthly reports on program categories such as white collar crime, immigration, drugs, weapons and terrorism and on selected government agencies such as the IRS, FBI, ATF and DHS. For the latest information on prosecutions and convictions, go to http://trac.syr.edu/tracreports/bulletins/. In addition, subscribers to the TRACFed data service can generate custom reports for a specific agency, judicial district, program category, lead charge or judge via the TRAC Data Interpreter.