Federal Criminal Prosecutions Fall Under Trump
Despite tough talk on cracking down on crime from the President and from Attorney General Sessions, actual criminal prosecutions and convictions secured by federal prosecutors have dropped. The latest available data from the Justice Department show that during the first ten months of FY 2017 the government reported 86,537 new criminal convictions. If this activity continues at the same pace, the annual total of convictions will be 103,844 for this fiscal year. (See Table 1.)
| Number Year-to-date | 86,537 |
|---|---|
| Percent Change from previous year | -12.3 |
| Percent Change from 5 years ago | -31.3 |
| Percent Change from 10 years ago | 8.7 |
| Percent Change from 20 years ago | 107 |
According to the case-by-case government records analyzed by the Transactional Records Access Clearinghouse (TRAC) at Syracuse University, this estimate is down 12.3 percent over the past fiscal year when the number of convictions totaled 118,384. Compared to five years ago when there were 151,129 criminal convictions, the estimate of FY 2017 convictions is down 31.3 percent. And new filings of federal criminal prosecutions are similarly down.
The long term trend in convictions for these matters going back to FY 1997 is shown more clearly in Figure 1. The vertical bars in Figure 1 represent the number of convictions recorded each fiscal year. Projected figures for the current fiscal year are shown. Each presidential administration is distinguished by the color of the bars.
These comparisons of the number of defendants convicted for offenses are based on case-by-case information obtained by TRAC under the Freedom of Information Act from the U.S. Department of Justice, Executive Office for United States Attorneys.
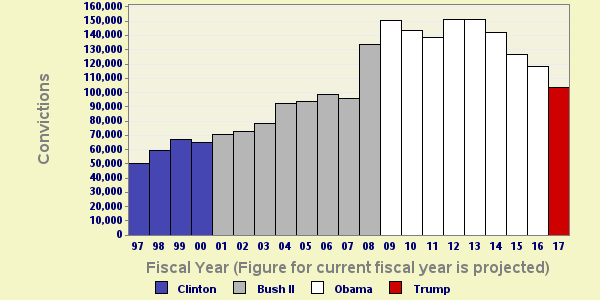
Figure 1: Criminal Convictions over the last 20 years
Leading Program Areas
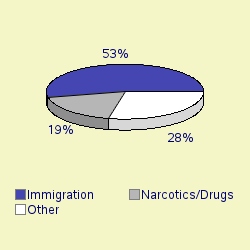
Total convictions were classified by prosecutors into more specific types. The single largest number of convictions through July 2017 was for immigration offenses. These offenses accounted for 53.1 percent of all convictions. The second largest number of matters were convictions under the Department of Justice's programs for prosecuting federal violations of narcotic and drug laws (18.6%).
Declines in criminal prosecutions in both the immigration and drug areas have contributed to the overall decline in total federal convictions this year. The pace of immigration convictions during the first ten months of FY 2017 was down 17.1 percent, while those for drug crimes have declined by 4.0 percent. Nationally, this year's federal drug convictions have fallen to their lowest recorded level since FY 1997.
Figure 2 summarizes the composition of federal convictions this year. The "Other" category in Figure 2 is comprised of a diverse group of programs. The largest specific programs within this grouping were weapons offenses (6.6%) and various white-collar crimes (5.3%).
Leading Investigative Agencies
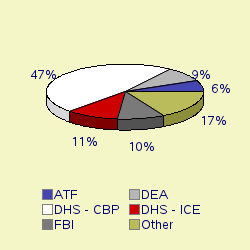
The lead investigative agency for the most convictions through July 2017 was the Customs and Border Protection in the Department of Homeland Security (DHS). That agency accounted for 47.2 percent of those investigations leading to convictions.
Additional agencies with substantial numbers of convictions included the DHS Immigration and Customs Enforcement (ICE) with 10.9 percent. Next, the following investigative agencies within the Department of Justice played significant roles: the Federal Bureau of Investigation (9.7%), the Drug Enforcement Administration (9.0%), and Alcohol, Tobacco, Firearms, and Explosives (6.4%).
Remaining agencies with significant contributions within the "Other" category shown in Figure 3 were from the Department of Interior (2.5%), and referrals from state and local authorities (2.1%).
Top Ranked Lead Charges
Table 2 shows the top lead charge recorded in those prosecutions that resulted in convictions in U.S. district and magistrate courts during the first ten months of FY 2017. Immigration laws lead the list, followed by drug provisions. The dominant federal crimes listed have stayed virtually the same over the last decade. Indeed, the list of the top six federal offenses this past year was identical to that of a decade ago.
Most convictions were the result of guilty pleas, rather than actual trials. When plea bargaining took place, the original lead charges listed in Table 2 may be pled down to a lesser charge. Hence the offenses listed may not correspond with the actual charge the defendant was convicted for. For example, an illegal re-entry felony charge frequently was reduced to a petty misdemeanor offense of illegal entry under a plea agreement (See earlier TRAC report).
| Lead Charge | Count | Rank | 1 yr ago | 5 yrs ago | 10 yrs ago | 20 yrs ago |
|---|---|---|---|---|---|---|
| 08 USC 1326 - Reentry of deported alien | 21,927 | 1 | 2 | 2 | 1 | 3 |
| 08 USC 1325 - Entry of alien at improper time or place; etc. | 20,484 | 2 | 1 | 1 | 2 | 13 |
| 21 USC 841 - Drug Abuse Prevention & Control-Prohibited acts A | 7,879 | 3 | 3 | 3 | 3 | 2 |
| 21 USC 846 - Attempt and conspiracy | 6,261 | 4 | 4 | 4 | 4 | 1 |
| 18 USC 922 - Firearms; Unlawful acts | 5,101 | 5 | 5 | 5 | 5 | 5 |
| 08 USC 1324 - Bringing in and harboring certain aliens | 2,700 | 6 | 6 | 6 | 6 | 10 |
| Federal Regulation | 1,179 | 7 | 7 | 8 | 17 | 129 |
| 21 USC 952 - Importation of controlled substances | 900 | 8 | 9 | 7 | 8 | 7 |
| 18 USC 2252 - Material involving sexual exploitation of minors | 841 | 9 | 8 | 9 | 16 | 35 |
| Other US Code Section | 712 | 10 | 11 | 19 | 41 | 26 |
Table 2: Top charges for convictions
Top Ranked Judicial Districts
While there are 94 separate federal judicial districts, these districts vary greatly in population size. The most populous district is the Central District of California where Los Angeles is located. This district has over thirty-five times the population size of the federal judicial district in Wyoming, and over thirty times the population of the federal judicial district in Vermont. Thus, the number of federal prosecutions in each district naturally can be expected to vary.
However the five districts along the southwest border with Mexico - whether compared on the basis of raw conviction counts, or on per capita rates of criminal convictions - occupied the top five out of six spots as the most active districts in the country. These five districts alone accounted for nearly six out of ten (58.6%) of federal convictions of all types during the first ten months of FY 2017. This reflected the fact that immigration prosecutions - chiefly for illegal entry and re-entry—were such a dominant component of all federal prosecutions. And these crimes were concentrated along the southwest border.
When compared relative to population size, the other districts ranked within the ten most active in the country were all districts without any major urban centers. See Table 3. In fifth place, was the federal judicial district in Wyoming with five times the number of federal criminal convictions relative to its population size than the national average.
The other top ranked districts based on per capita convictions were: South Dakota (ranked seventh), North Dakota (ranked eighth), Montana (ranked ninth), and Vermont (ranked tenth). The federal judicial district of Vermont had moved up in its rankings from fifteenth place during FY 2016. It was also the federal judicial district that showed the greatest growth in the rate of convictions compared to one year ago—up 21.9 percent.
The other top ranking districts had all placed in the top ten a year ago as well as this year. The Southern District of Alabama (Mobile), which had ranked tenth on convictions relative to its population size during FY 2016, slipped to eleventh place in FY 2017.
This year the judicial district recording the largest drop in the rate of convictions- down 32.6 percent-was the Southern District of Texas (Houston).
| Judicial District | Percapita | Count | Rank | 1yr ago | 5yrs ago | 10yrs ago | 20yrs ago |
|---|---|---|---|---|---|---|---|
| Arizona | 2,633 | 14,982 | 1 | 4 | 1 | 3 | 4 |
| Texas, W | 2,548 | 14,821 | 2 | 1 | 2 | 6 | 17 |
| N Mexico | 1,995 | 3,466 | 3 | 3 | 4 | 5 | 5 |
| Texas, S | 1,816 | 14,345 | 4 | 2 | 3 | 2 | 10 |
| Wyoming | 1,740 | 850 | 5 | 5 | 5 | 1 | 15 |
| Cal, S | 1,074 | 3,115 | 6 | 6 | 6 | 4 | 1 |
| S Dakota | 604 | 425 | 7 | 7 | 7 | 9 | 6 |
| N Dakota | 461 | 291 | 8 | 8 | 11 | 13 | 23 |
| Montana | 437 | 376 | 9 | 9 | 13 | 12 | 9 |
| Vermont | 372 | 194 | 10 | 15 | 14 | 30 | 21 |
Table 3: Top 10 districts (per one million people)
TRAC offers free monthly reports on program categories such as white collar crime, immigration, drugs, weapons and terrorism and on selected government agencies such as the IRS, FBI, ATF and DHS. For the latest information on prosecutions and convictions, go to http://trac.syr.edu/tracreports/bulletins/. In addition, subscribers to the TRACFed data service can generate custom reports for a specific agency, judicial district, program category, lead charge or judge via the TRAC Data Interpreter.