EPA Criminal Prosecutions Down by Half in Last Five Years
| Number Year-to-date | 81 |
| Percent Change from previous year | -20.0 |
| Percent Change from 5 years ago | -51.6 |
| Percent Change from 10 years ago | -41.7 |
| Percent Change from 20 years ago | -26.7 |
This year the country is poised to have the lowest number of criminal prosecutions from investigations by the Environmental Protection Agency (EPA) for over two decades. The latest available data from the Justice Department show that during the first eleven months of FY 2016 the government reported 81 new prosecutions resulting from investigations lead by EPA. If this activity continues at the same pace, the annual total of prosecutions will be 88 for this fiscal year.
Compared to five years ago when there were 182 individuals and businesses prosecuted, the estimate of FY 2016 prosecutions of this type is less than half the level earlier in President Obama's administration. Criminal prosecutions resulting from EPA referrals to federal prosecutors peaked during FY 1998 when President Clinton was in office when they reached 198, and were nearly as high at 196 during the first year of President Bush's administration.
The comparisons of the number of defendants charged with offenses are based on case-by-case information obtained by the Transactional Records Access Clearinghouse (TRAC) at Syracuse University under the Freedom of Information Act from the Executive Office for United States Attorneys (see Table 1).
Not all EPA criminal referrals to federal prosecutors result in an actual prosecution. However, the decline in prosecutions has been driven largely by the decline in EPA criminal referrals. In fact, during the Obama administration federal prosecutors filed criminal charges in 43.1 percent of EPA referrals, compared with 40.2 percent during the prior Bush administration.
While most EPA referrals are of individuals accused of committing environmental crimes, about one if four (23.9%) of its referrals during the Obama years have been businesses. Businesses also made up 23.0 percent of those prosecuted during the same period.
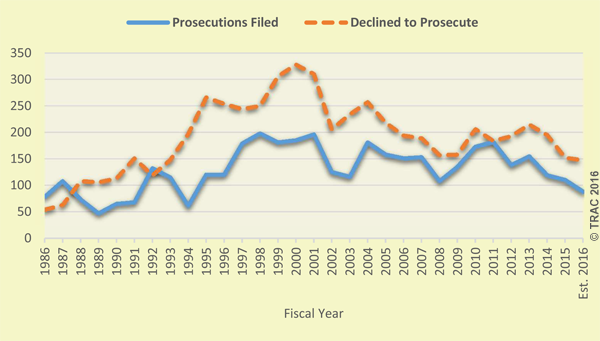
The long term trend in prosecutions for these matters going back to FY 1986 is shown more clearly in Figure 1. The blue solid line in Figure 1 represents the number of prosecutions recorded each year, while the orange dotted line shows the number of EPA referrals that federal prosecutors closed without prosecuting.
Conviction and Sentencing
A total of 63 defendants have been convicted during the first 11 months of FY 2016. All but two pled guilty, while the remaining 2 defendants was convicted after a jury trial. The most frequent conviction (19) involved water pollution under Title 33 Section 1319 of the U.S. Code. The next most frequent (8) was for violating federal standards for air pollution prevention and control under 42 U.S.C. 7413. The third most common conviction (6) this past year was under 42 U.S.C. 6298 for hazardous waste management.
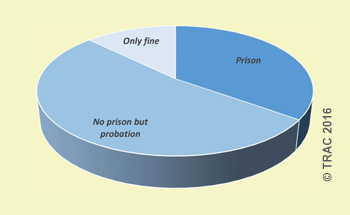
A total of 22 out of the 63 who were convicted received prison sentences. The sentence for the most prison time was for 121 months, and the typical (median) sentence for those receiving prison time was 12 months. An additional 33 received probation instead of any prison time. The typical probation sentence was for 36 months. The remaining 8 received neither prison nor probation but were fined. See Figure 2.
Top Ranked Judicial Districts
Understandably, there is great variation in the number of prosecutions in each of the nation's ninety-four federal judicial districts. The districts registering the largest number of prosecutions of this type during the first eleven months of FY 2016 are shown in Table 2.
The Eastern District of Louisiana (New Orleans)—with 9 prosecutions—was the most active through August 2016.
The Western District of Louisiana (Shreveport) ranked 2nd.
The Southern District of Florida (Miami) now ranks 3rd.
TRAC offers free monthly reports on program categories such as white collar crime, immigration, drugs, weapons and terrorism and on selected government agencies such as the IRS, FBI, ATF and DHS. For the latest information on prosecutions and convictions, go to http://trac.syr.edu/tracreports/bulletins/. In addition, subscribers to the TRACFed data service can generate custom reports for a specific agency, judicial district, program category, lead charge or judge via the TRAC Data Interpreter.