ATF Prosecutions Turning Around in FY 2012
Number Year-to-date 6,258 Percent Change from previous year 5.9 Percent Change from 5 years ago -6.7 Percent Change from 10 years ago 25.8 Percent Change from 20 years ago 51.7
Table 1. ATF Criminal ProsecutionsThe latest available data from the Justice Department show that, during the first eight months of FY 2012, the number of prosecutions for weapons and other offenses referred by the Bureau of Alcohol, Tobacco, Firearms and Explosives (ATF) has staged a turnaround. As TRAC previously reported, ATF-referred prosecutions peaked during fiscal year 2005 and since then cases had been steadily falling. However, so far during FY 2012, the government has reported that prosecutions are trending upwards, with 6,258 new matters filed.
The ATF is the federal agency with the primary responsibility for the investigation of a wide range of crimes involving the illegal use and trafficking of firearms, the illegal use and storage of explosives, arson and the illegal diversion of alcohol and tobacco products. The observed increase in prosecutions is noteworthy particularly in the wake of criticism of ATF programs such as Fast and Furious which ran from late 2009 until early 2011.
If this activity continues at the same pace, the annual total of prosecutions will be 9,387 for this fiscal year. According to the case-by-case information analyzed by the Transactional Records Access Clearinghouse (TRAC), this estimate is up 5.9 percent over the past fiscal year when the number of prosecutions totaled 8,861.
The comparisons of the number of defendants charged with offenses are based on case-by-case information obtained by TRAC under the Freedom of Information Act from the Executive Office for United States Attorneys (see Table 1).
Longer Term Trends
Compared to five years ago when there were 10,065 ATF-referred prosecutions, the estimate of FY 2012 prosecutions of this type is still down 6.7 percent. Prosecutions over the past year are, however, higher than they were ten years ago. Overall, the data show that prosecutions of this type are up 25.8 percent from the level of 7,463 reported in 2002 and up 51.7 percent from the level of 6,187 reported in 1992.
The long term trend in prosecutions for these matters going back to FY 1992 is shown more clearly in Figure 1. The vertical bars in Figure 1 represent the number of ATF prosecutions recorded each fiscal year. Projected figures for the current fiscal year are shown. Each presidential administration is distinguished by the color of the bars. To view trends month-by-month rather than year-by-year, see TRAC's monthly report series for the latest data.
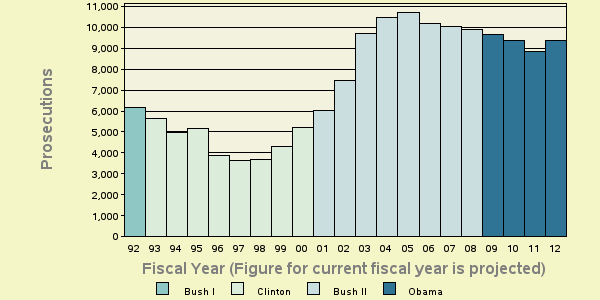
Figure 1. ATF Criminal Prosecutions Over the Last 20 Years
Top Ranked Judicial Districts
During FY 2011 the Justice Department said there were 28.9 ATF-referred prosecutions for every one million people in the United States. If the pace during the first eight months of FY 2012 continues at the same rate, this fiscal year there will 30.6 ATF prosecutions for every one million people in the United States.
Understandably, there is great variation in the per capita number of prosecutions in each of the nation's ninety-four federal judicial districts. However, one striking feature is the apparent concentration of these cases in districts outside of the major metropolitan areas. Just in sheer numbers, the Eastern District of North Carolina headquartered in Raleigh lead the nation with the most prosecutions filed — 242 so far this fiscal year. Kansas was second with 232.
Taking into consideration the varying size of each judicial district, Kansas slipped to second place relative to its population size and North Carolina East was fifth on a per capita basis.
Judicial District Percapita Count Rank Current 1yr ago 5yrs ago 10yrs ago 20yrs ago Ala, S 142 78 1 1 5 6 4 Kansas 123 232 2 3 22 47 57 W Virg, N 114 68 3 21 28 16 25 Tenn, E 101 169 4 4 11 26 12 N Car, E 99 242 5 8 38 21 23 Tenn, W 89 92 6 7 2 3 6 Montana 86 56 7 24 4 14 47 Alaska 83 38 8 9 32 39 13 Ga, S 78 76 9 2 10 15 67 N Mexico 75 100 10 5 30 22 20
Table 2. Top 10 Districts (Per One Million People)
Table 2 lists the top ten judicial districts for the number of ATF-referred criminal prosecutions so far this year relative to population size.
The most active district through May 2012 was the Southern District of Alabama (Mobile), with 141.77 prosecutions per one million people, compared with 30.6 prosecutions per one million people overall in the United States. This district has consistently been one of the most active relative to its population size for a number of years: it was also ranked first a year ago, while it was ranked fifth five years ago. The district's position ten years ago was sixth; twenty years ago, it was fourth.
Following Kansas, ranked second relative to its population as discussed above, the next most active district was the Northern District of West Virginia (Wheeling) which now ranks third in the country.
The federal judicial district which showed the greatest projected growth in the rate of prosecutions compared to one year ago — 137 percent — was the Northern District of West Virginia (Wheeling). Compared to five years ago, the district with the largest projected growth — 110 percent — was the Eastern District of North Carolina (Raleigh).
In the last year, the judicial District Court recording the largest projected drop in the rate of prosecutions — 25.5 percent — was the Southern District of Georgia (Savannah).
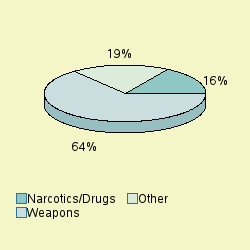
Figure 2: Specific types of prosecutionsLeading Program Areas
Cases were classified by prosecutors into more specific types. Most ATF prosecutions through May 2012 were weapons charges, accounting for 64.3 percent of prosecutions. Next were prosecutions filed under the program area of narcotics and drugs, with 16.2 percent.
[The Department of Justice is withholding the program area for 11.6 percent of the cases. These matters are also included in the "Other" category. TRAC, in ongoing litigation, has challenged the government's withholding of program category information, winning a substantial victory in September 2006 decision. The government, however, has filed a notice of appeal which has stayed the order requiring it to release program information.]
Top Ranked Lead Charges
Table 3 shows the top lead charges recorded in ATF prosecutions filed in U.S. District Court during the first eight months of FY 2012.
Note: There were an additional 118 other lead charges which were not individually ranked. See TRAC's latest monthly report for a list of all lead charges included in rankings for the latest month, or use TRACFED's criminal analyzer tool to obtain a complete listing for any year.
Lead Charge Count Rank Current 1 yr ago 5 yrs ago 10 yrs ago 20 yrs ago 18 USC 922 — Firearms; Unlawful acts 3,626 1 1 1 1 1 21 USC 841 — Drug Abuse Prevention & Control-Prohibited acts A 583 2 2 2 3 2 21 USC 846 — Attempt and conspiracy 358 3 3 3 4 4 18 USC 924 — Firearms; Penalties 265 4 4 4 2 3 18 USC 1951 — Hobbs Act 198 5 5 7 8 24 18 USC 371 — Conspiracy to commit offense or to defraud US 97 6 7 6 7 6 26 USC 5861 — Tax on Making Firearms — Prohibited acts 97 6 6 5 5 5 18 USC 2342 — Trafficking in contraband cigarettes Unlawful acts 45 8 9 10 18 81 21 USC 860 — Distribution or manufacturing in or near schools a 35 9 55 47 - 37 18 USC 844 — Explosives — Importation and storage of explosives 32 10 8 8 6 7 
Table 3. Top Charges Filed
"Firearms; Unlawful acts" (Title 18 U.S.C. Section 922) was the most frequently recorded lead charge. It was the most frequently invoked statute a year ago, five years ago, ten years ago and twenty years ago.
Ranked second in frequency was the lead charge "Drug Abuse Prevention & Control-Prohibited acts A" under Title 21 U.S.C. Section 841, which held the same ranking one year ago and five years ago. It was ranked third ten years ago and second twenty years ago.
Ranked third was "Attempt and conspiracy" under Title 21 U.S.C. Section 846, which was also ranked third a year ago and five years ago. It was the fourth most frequently invoked charge ten and twenty years ago.
Among these top ten lead charges, the one showing the greatest projected increase in prosecutions — up a whopping 5150 percent — compared to one year ago was Title 21 U.S.C. Section 860 that involves "Distribution or manufacturing in or near schools and colleges." This was the same statute that had the largest projected increase — 2525 percent — compared with five years ago.
Again among the top ten lead charges, the one showing the sharpest projected decline in prosecutions compared to one year ago — down 18.6 percent — was "Explosives — Importation and storage of explosives" (Title 18 U.S.C. Section 844). This was the same statute that had the largest projected decrease — 35.9 percent — compared with five years ago.
Report Date: July 31, 2012
