Tax Lawsuits Half Levels of a Decade Ago
The number of civil tax lawsuits filed in federal court remains steady, but are only half the number of a decade ago according to data analyzed by the Transactional Records Access Clearinghouse (TRAC), a research institute at Syracuse University. This decline is likely due to severe funding and staffing cuts imposed on the Internal Revenue Service (IRS) by Congress.
The latest available case-by-case data from the federal courts show that during July 2021 there were 47 new federal civil tax suits filed. Over the course of the last ten months, there have been 446 suits. If the same pace of filings continues for the final two months of FY 2021, the projected number of new tax litigation this year will be 535, about the same level that was observed during the prior fiscal year when 520 suits were filed.
Although the number of tax lawsuits remains consistent with last year, five years ago there were 905 new cases. Ten years ago there were 1,121 tax filings, more than twice the number today, and in 2008 there were 1,357. See Figure 1. The comparisons of the number of civil tax filings in federal district court are based on case-by-case court records which were compiled and analyzed by TRAC.
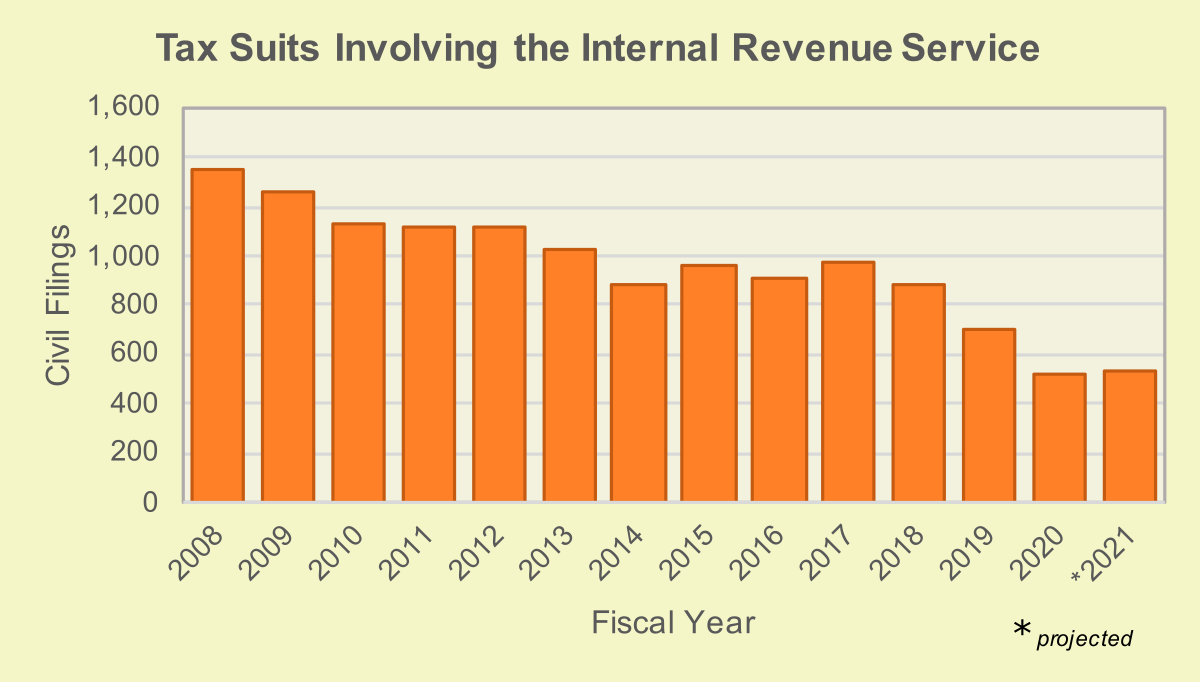
FY 2008 - FY 2021 (July)(Click for larger image)
While it is possible that some of this decline could be due to a slowdown during the pandemic, it appears more likely to be part of a longer term decline in IRS enforcement activity that has resulted from severe funding and staffing cuts imposed by Congress. For example, not only IRS tax audits have fallen but the number of levies, liens, and seizures for unpaid taxes by the IRS have all fallen off sharply which may reduce the need for either the IRS or the taxpayer to engage in litigation concerning these matters.
Who Is Suing Whom?
Thus far during FY 2021, the Internal Revenue Service or the federal government acting on its behalf sued taxpayers in six out of ten tax suits (60%), while taxpayers sued the IRS in the remaining four out of ten (40%). Both types of lawsuits have seen declines, with a somewhat sharper decline for suits the government brought against taxpayers.
The IRS usually sues taxpayers for three main reasons. The first and most frequent lawsuits concern tax liabilities. The second most common type of lawsuit involves enforcing an administrative summons to appear or to product tax records. The third is to enforce a federal tax lien. In this third type of action, the court can order the sale of property to satisfy unpaid taxes.
Audited taxpayers who disagree with the IRS audit results have several avenues to contest if administrative appeals within the IRS are unsuccessful. One of these is to pay the disputed tax and then sue for a refund or recovery of tax payment in the federal district court. Other common types of lawsuits brought by taxpayers seek to challenge wrongful levies for taxes or to seek to squash an IRS summons.
Tax Suits by Federal Judicial District
With the sharp decline in federal tax suits over the past ten years, most districts experienced declines. The Northern District of California (San Francisco) experienced the largest decline. Compared with 52 suits in FY 2011, there have only been 9 thus far during FY 2021.
But there were exceptions. The Eastern District of Virginia (Alexandria) actually saw an increase in litigation. Tax suits there doubled from 9 to 18 during this past decade. This district also ended up with twice the national average relative to the size of its population.
However, the Southern District of Florida (Miami) had the highest per capita rate of tax filings during FY 2021. Its 36 tax suits were almost 3.5 times the national average. Details on the number of federal tax suits by federal judicial district, along with their per capita rates, are shown in Table 1. Both figures for FY 2021 and for ten years earlier during FY 2011 are provided.
| Federal District | Number | Rate** | ||
|---|---|---|---|---|
| FY 2011 | FY 2021* | FY 2011 | FY 2021* | |
| -All- | 1,121 | 446 | 3.6 | 1.4 |
| Fla, S | 49 | 36 | 7.2 | 4.8 |
| Nebraska | 2 | 8 | 1.1 | 4.1 |
| Mo, E | 8 | 9 | 2.7 | 3.1 |
| Montana | 3 | 3 | 3.0 | 2.8 |
| Virg, E | 9 | 18 | 1.5 | 2.8 |
| Texas, S | 21 | 27 | 2.4 | 2.7 |
| Fla, M | 25 | 31 | 2.4 | 2.6 |
| N Dakota | 1 | 2 | 1.5 | 2.6 |
| Ga, M | 2 | 5 | 1.0 | 2.5 |
| Tenn, W | 10 | 4 | 6.3 | 2.5 |
| Cal, S | 19 | 8 | 5.7 | 2.3 |
| Mich, E | 26 | 13 | 4.0 | 2.0 |
| Ill, C | 6 | 4 | 2.7 | 1.8 |
| La, E | 9 | 3 | 5.6 | 1.8 |
| Cal, C | 87 | 34 | 4.6 | 1.7 |
| Colorado | 39 | 10 | 7.6 | 1.7 |
| Maryland | 18 | 10 | 3.1 | 1.7 |
| Texas, N | 44 | 13 | 6.5 | 1.7 |
| Miss, S | 10 | 3 | 5.4 | 1.6 |
| N. J. | 39 | 14 | 4.4 | 1.6 |
| Utah | 15 | 5 | 5.3 | 1.6 |
| Vermont | 2 | 1 | 3.2 | 1.6 |
| Ill, N | 30 | 14 | 3.2 | 1.5 |
| New Hamp | 6 | 2 | 4.5 | 1.5 |
| Alaska | 2 | 1 | 2.9 | 1.4 |
| Ark, W | 3 | 2 | 2.3 | 1.4 |
| Conn | 12 | 5 | 3.3 | 1.4 |
| Hawaii | 16 | 2 | 11.6 | 1.4 |
| Minnesota | 14 | 8 | 2.6 | 1.4 |
| Virg, W | 2 | 3 | 0.9 | 1.4 |
| Nevada | 15 | 4 | 5.5 | 1.3 |
| Wash, W | 22 | 8 | 4.1 | 1.3 |
| Ala, S | 1 | 1 | 1.2 | 1.2 |
| Ga, S | 2 | 2 | 1.3 | 1.2 |
| Ohio, S | 15 | 7 | 2.6 | 1.2 |
| Wisc, W | 28 | 3 | 12.0 | 1.2 |
| Cal, E | 27 | 9 | 3.5 | 1.1 |
| Cal, N | 52 | 9 | 6.6 | 1.1 |
| Ind, N | 1 | 3 | 0.4 | 1.1 |
| Mich, W | 2 | 4 | 0.6 | 1.1 |
| Texas, W | 25 | 8 | 3.9 | 1.1 |
| Arizona | 8 | 7 | 1.2 | 1.0 |
| Delaware | 0 | 1 | 0.0 | 1.0 |
| Ga, N | 19 | 7 | 3.0 | 1.0 |
| N Car, E | 1 | 4 | 0.3 | 1.0 |
| N Mexico | 8 | 2 | 3.8 | 1.0 |
| N. Y., E | 18 | 8 | 2.2 | 1.0 |
| N. Y., S | 20 | 5 | 3.9 | 1.0 |
| S Car | 12 | 5 | 2.6 | 1.0 |
| Ala, M | 2 | 1 | 1.8 | 0.9 |
| La, W | 7 | 2 | 3.3 | 0.9 |
| Mass | 21 | 6 | 3.2 | 0.9 |
| Miss, N | 4 | 1 | 3.6 | 0.9 |
| N Car, W | 2 | 3 | 0.7 | 0.9 |
| Okla, N | 5 | 1 | 4.9 | 0.9 |
| Okla, W | 5 | 2 | 2.5 | 0.9 |
| Oregon | 17 | 4 | 4.4 | 0.9 |
| R. I. | 6 | 1 | 5.7 | 0.9 |
| Iowa, N | 2 | 1 | 1.5 | 0.8 |
| Ill, S | 1 | 1 | 0.8 | 0.8 |
| Penn, E | 33 | 5 | 5.7 | 0.8 |
| Tenn, E | 7 | 2 | 2.8 | 0.8 |
| Ark, E | 10 | 1 | 6.1 | 0.6 |
| Penn, M | 6 | 2 | 1.9 | 0.6 |
| Wash, E | 3 | 1 | 2.0 | 0.6 |
| Fla, N | 7 | 1 | 4.0 | 0.5 |
| Iowa, S | 6 | 1 | 3.4 | 0.5 |
| Ind, S | 5 | 2 | 1.3 | 0.5 |
| Ohio, N | 20 | 3 | 3.5 | 0.5 |
| Penn, W | 17 | 2 | 4.5 | 0.5 |
| Tenn, M | 15 | 1 | 6.6 | 0.4 |
| Mo, W | 4 | 1 | 1.3 | 0.3 |
| N Car, M | 3 | 1 | 1.1 | 0.3 |
| N. Y., N | 7 | 1 | 2.0 | 0.3 |
| Wisc, E | 6 | 1 | 1.8 | 0.3 |
| Texas, E | 8 | 1 | 2.2 | 0.2 |
| Ala, N | 3 | 0 | 1.1 | 0.0 |
| D. C. | 10 | 0 | 16.1 | 0.0 |
| Idaho | 3 | 0 | 1.9 | 0.0 |
| Kansas | 7 | 0 | 2.4 | 0.0 |
| Ken, E | 9 | 0 | 4.1 | 0.0 |
| Ken, W | 6 | 0 | 2.7 | 0.0 |
| La, M | 5 | 0 | 6.2 | 0.0 |
| Maine | 2 | 0 | 1.5 | 0.0 |
| N. Y., W | 4 | 0 | 1.4 | 0.0 |
| Okla, E | 2 | 0 | 2.7 | 0.0 |
| S Dakota | 1 | 0 | 1.2 | 0.0 |
| W Virg, N | 7 | 0 | 7.6 | 0.0 |
| W Virg, S | 5 | 0 | 5.4 | 0.0 |
| Wyoming | 2 | 0 | 3.5 | 0.0 |