Civil Rights Suits Against Schools More Than Double in Last Four Years
| FY to date | 497 |
| Projected FY 2017 | 596 |
| Number FY 2016 | 554 |
| Percent Change from 2016 | 7.7% |
| Percent Change from 2013 | 106% |
The latest available data from the federal courts show that civil rights suits against schools have more than doubled during the last four years. During July 2017 the government reported 51 new civil lawsuits over alleged violations of civil rights involving schools, colleges and other educational institutions. According to the case-by-case court records analyzed by the Transactional Records Access Clearinghouse (TRAC) at Syracuse University this brings the total of such suits to 497 during the first ten months of FY 2017. See Table 1 and Figure 1.
If a similar pace of filings continues through the end of FY 2017, civil rights filings involving educational institutions will reach an estimated 596 during a single year. This would be the largest number recorded since the court began tracking this class of cases in October of 2011.
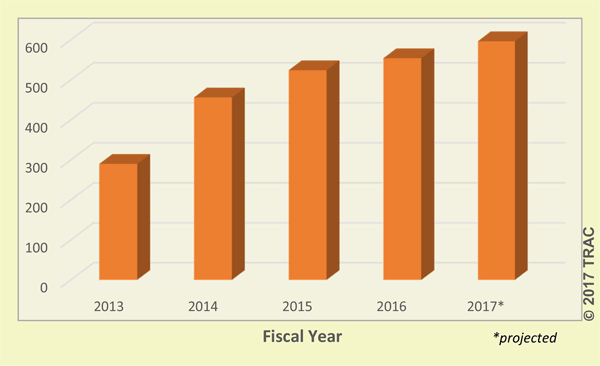
Figure 1. Federal Civil Rights Suits Filed Involving Schools, FY 2013 - FY 2017
Nature of the Litigation
Schools and universities were typically the defendants in these actions. Usually schools were being sued over the alleged violation of the civil rights of their students, although some civil rights challenges also were brought by employees. Occasionally schools brought suit as plaintiffs to challenge policies or practices involving civil rights matters.
During FY 2017, the largest volume of litigation involved the treatment of students with disabilities. Over four out of ten suits (41.6%) cited a cause of action based upon this allegation vis-à-vis students. When broader claims under the Americans with Disabilities Act and related statutes were added that might involve job applicants or employees, the percentage climbed to just under half of all suits that named disability issues.
Most of the remaining suits (32.0%) cited more general civil rights provisions as the basis of the suit, without further specifying the nature of the alleged violation. The next largest segment of litigation - 12.1 percent -- cited alleged sex discrimination as the grounds for the suit.
Where Suits Were Filed
Thus far this year the largest number of civil rights cases involving schools have been filed in the Southern District of New York (Manhattan). In that district alone there have been 37 new suits. New Jersey was second with 33 suits, followed by the District of Columbia with 28.
The Eastern District of Pennsylvania (Philadelphia) came in fourth with 26 new suits, followed by the Northern District of Ohio (Cleveland) in fifth place with 20.
Once the size of population is considered, the District of Columbia ranked highest, followed by Rhode Island, and then the Southern District of New York (Manhattan). The Eastern District of Arkansas (Little Rock) also rose to fifth place based upon cases filed relative to its population size.
Table 2 provides details on rankings for all remaining federal judicial districts.
| Federal Judicial District* | Lawsuits | Rank | ||
|---|---|---|---|---|
| Number | Rate** | Number | Rate | |
| Total | 497 | 1.5 | ||
| N. Y., S | 37 | 7.0 | 1 | 3 |
| N. J. | 33 | 3.7 | 2 | 7 |
| D. C. | 28 | 41.7 | 3 | 1 |
| Penn, E | 26 | 4.4 | 4 | 4 |
| Ohio, N | 20 | 3.5 | 5 | 8 |
| Cal, C | 18 | 0.9 | 6 | 53 |
| Cal, E | 15 | 1.9 | 7 | 25 |
| Ohio, S | 13 | 2.2 | 8 | 19 |
| Cal, N | 13 | 1.6 | 8 | 29 |
| Texas, N | 12 | 1.7 | 10 | 26 |
| N. Y., E | 12 | 1.4 | 10 | 34 |
| Minnesota | 11 | 2.0 | 12 | 24 |
| Texas, W | 10 | 1.4 | 13 | 34 |
| Ill, N | 10 | 1.1 | 13 | 44 |
| R. I. | 9 | 8.5 | 15 | 2 |
| Penn, W | 9 | 2.4 | 15 | 16 |
| Mass | 9 | 1.3 | 15 | 40 |
| Kansas | 8 | 2.7 | 18 | 12 |
| N. Y., N | 8 | 2.3 | 18 | 18 |
| Ark, E | 7 | 4.3 | 20 | 5 |
| Iowa, S | 7 | 3.9 | 20 | 6 |
| Ga, N | 7 | 1.1 | 20 | 44 |
| Virg, E | 7 | 1.1 | 20 | 44 |
| Ken, W | 6 | 2.7 | 24 | 12 |
| Tenn, M | 6 | 2.5 | 24 | 15 |
| N. Y., W | 6 | 2.1 | 24 | 21 |
| Conn | 6 | 1.7 | 24 | 26 |
| N Car, E | 6 | 1.5 | 24 | 32 |
| Oregon | 6 | 1.5 | 24 | 32 |
| Maryland | 6 | 1.0 | 24 | 48 |
| Fla, S | 6 | 0.8 | 24 | 56 |
| Texas, S | 6 | 0.6 | 24 | 65 |
| Cal, S | 5 | 1.4 | 33 | 34 |
| Mich, W | 5 | 1.4 | 33 | 34 |
| Mich, E | 5 | 0.8 | 33 | 56 |
| Fla, M | 5 | 0.4 | 33 | 72 |
| Ark, W | 4 | 3.0 | 37 | 9 |
| Maine | 4 | 3.0 | 37 | 9 |
| Idaho | 4 | 2.4 | 37 | 16 |
| Miss, S | 4 | 2.1 | 37 | 21 |
| N Car, M | 4 | 1.4 | 37 | 34 |
| Colorado | 4 | 0.7 | 37 | 62 |
| Wash, W | 4 | 0.7 | 37 | 62 |
| Arizona | 4 | 0.6 | 37 | 65 |
| Okla, N | 3 | 2.8 | 45 | 11 |
| Hawaii | 3 | 2.1 | 45 | 21 |
| Nebraska | 3 | 1.6 | 45 | 29 |
| Mo, W | 3 | 1.0 | 45 | 48 |
| Nevada | 3 | 1.0 | 45 | 48 |
| Penn, M | 3 | 0.9 | 45 | 53 |
| N Dakota | 2 | 2.6 | 51 | 14 |
| W Virg, S | 2 | 2.2 | 51 | 19 |
| Ill, S | 2 | 1.6 | 51 | 29 |
| La, E | 2 | 1.2 | 51 | 42 |
| N Mexico | 2 | 1.0 | 51 | 48 |
| Virg, W | 2 | 0.9 | 51 | 53 |
| Ind, N | 2 | 0.8 | 51 | 56 |
| Tenn, E | 2 | 0.8 | 51 | 56 |
| Mo, E | 2 | 0.7 | 51 | 62 |
| Ind, S | 2 | 0.5 | 51 | 69 |
| Wyoming | 1 | 1.7 | 61 | 26 |
| Alaska | 1 | 1.4 | 61 | 34 |
| Okla, E | 1 | 1.3 | 61 | 40 |
| S Dakota | 1 | 1.2 | 61 | 42 |
| Delaware | 1 | 1.1 | 61 | 44 |
| Montana | 1 | 1.0 | 61 | 48 |
| Iowa, N | 1 | 0.8 | 61 | 56 |
| New Hamp | 1 | 0.8 | 61 | 56 |
| Tenn, W | 1 | 0.6 | 61 | 65 |
| Wash, E | 1 | 0.6 | 61 | 65 |
| Fla, N | 1 | 0.5 | 61 | 69 |
| La, W | 1 | 0.5 | 61 | 69 |
| Ill, C | 1 | 0.4 | 61 | 72 |
| Wisc, W | 1 | 0.4 | 61 | 72 |
| Ala, N | 1 | 0.3 | 61 | 75 |
| Texas, E | 1 | 0.3 | 61 | 75 |
| Utah | 1 | 0.3 | 61 | 75 |
| S Car | 1 | 0.2 | 61 | 78 |
Each month, TRAC offers a free report focused on one area of civil litigation in the U.S. district courts. In addition, subscribers to the TRACFed data service can generate custom reports by district, office, nature of suit or federal jurisdiction via the TRAC Data Interpreter.