Civil Asset Forfeiture Filings Lower But Usage Varies Widely
The latest available data from the federal courts show that during April 2017 the government reported 74 new civil asset forfeiture filings. For the twelve months ending in April, the number of these filings was just 984. According to the case-by-case information analyzed by the Transactional Records Access Clearinghouse (TRAC), this running 12-month total is down 15 percent from one year ago in April 2016, and down 56 percent from the comparable levels reported five years ago in April 2012. See Table 1.
| Number Latest Month | 74 |
| Number Latest 12 Months | 984 |
| Percent Change from 1 year ago | -14.9% |
| Percent Change from 5 years ago | -55.5% |
Asset forfeiture involves confiscation of assets by the state. The objective is to deprive the individual of the alleged proceeds of crime, or of property used in the commission of crime. While asset forfeiture can be used in criminal prosecutions, the government can instead choose to bring a civil action simply to confiscate money or property.
Examples of civil asset forfeiture suits filed in April 2017, for example, bear case titles such as: United States of America v. $75,000.00 in U.S. Currency; United States of America v. 460 Cottongrass, Teton County, Idaho; and United States of America v. One 2011 Chevrolet Tahoe. This is because the assets or property, not actual individuals, are being sued in these actions.
The use—and alleged misuse—of asset forfeiture laws at the federal, state and local level have long been a subject of spirited public debate[1]. Justice Thomas recently weighed into this debate in a statement on a petition for a writ of certiorari to the U.S. Supreme Court. He noted: "Modern civil forfeiture statutes ... often enable the government to seize the property without any predeprivation judicial process and to obtain forfeiture of the property even when the owner is personally innocent [of any crime]. ... This system - where police can seize property with limited judicial oversight and retain it for their own use - has led to egregious and well-chronicled abuses."
Figure 1 displays the long-term trend for these types of civil forfeiture cases at the federal level. To smooth out natural month-to-month fluctuations, the running 12-month total of federal civil forfeiture filings since September 2008 are shown. These comparisons of the number of civil filings are based on case-by-case court records that were compiled and analyzed by TRAC.
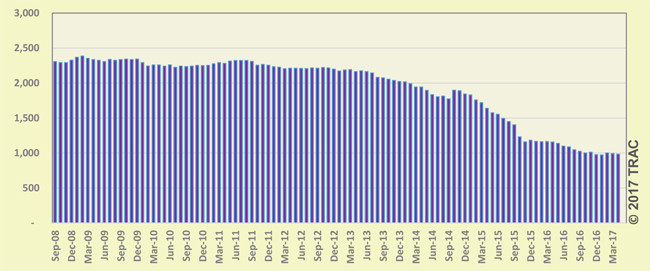
Figure 1. Running 12-Month Totals of Federal Civil Asset Forfeiture Filings, September 2008 - April 2017
Variation in Use Among U.S. Attorney Offices
There was wide variation in the use of civil asset forfeiture filings among the 93 U.S. Attorney offices during the first seven months of FY 2017. While the national average was around 2 filings per million population, some offices had three or more times the national average.
Relative to its population size, the Western District of New York (Buffalo) had the highest rate of filings with over four times the national average. The Southern District of Alabama (Mobile) was second, with three and a half times the national average, while New Mexico was third with a rate that was three times the national average.
In terms of sheer number of suits, the Central District of California (Los Angeles) had the most with a total of 51 civil asset forfeiture cases during the first seven months of FY 2017. Puerto Rico was second with 27 suits filed, followed by the Western District of New York with 23.
Table 2 provides the number of civil asset forfeiture filings, along with rates and rankings, for each of the U.S. Attorney offices thus far in FY 2017. Offices which had no cases are not listed.
| Number | Rank | |||
|---|---|---|---|---|
| District Office | Filings | Rate* | Filings | Rate |
| N. Y., W | 23 | 8.2 | 3 | 1 |
| Ala, S | 6 | 7.1 | 36 | 2 |
| N Mexico | 13 | 6.2 | 18 | 3 |
| Ala, M | 6 | 5.2 | 36 | 4 |
| Wyoming | 3 | 5.1 | 52 | 5 |
| N Car, E | 19 | 4.8 | 6 | 6 |
| Montana | 5 | 4.8 | 42 | 6 |
| Ill, S | 6 | 4.7 | 36 | 8 |
| Kansas | 13 | 4.5 | 18 | 9 |
| D. C. | 3 | 4.5 | 52 | 9 |
| Delaware | 4 | 4.2 | 46 | 11 |
| N. Y., N | 14 | 4.1 | 12 | 12 |
| Cal, S | 14 | 4.0 | 12 | 13 |
| Conn | 14 | 3.9 | 12 | 14 |
| Mo, E | 11 | 3.7 | 22 | 15 |
| Texas, E | 14 | 3.6 | 12 | 16 |
| Colorado | 18 | 3.3 | 7 | 17 |
| N Car, W | 10 | 3.2 | 23 | 18 |
| Tenn, W | 5 | 3.2 | 42 | 18 |
| N Car, M | 9 | 3.1 | 24 | 20 |
| Ind, N | 8 | 3.1 | 25 | 20 |
| Arizona | 19 | 2.8 | 5 | 22 |
| Alaska | 2 | 2.8 | 62 | 22 |
| Cal, C | 51 | 2.6 | 1 | 24 |
| Ala, N | 7 | 2.4 | 33 | 25 |
| La, M | 2 | 2.4 | 62 | 25 |
| Fla, S | 17 | 2.3 | 8 | 27 |
| Ga, N | 15 | 2.3 | 11 | 27 |
| Maryland | 14 | 2.3 | 12 | 27 |
| Texas, N | 16 | 2.2 | 10 | 30 |
| Ark, W | 3 | 2.2 | 52 | 30 |
| W Virg, S | 2 | 2.2 | 62 | 30 |
| Texas, S | 20 | 2.1 | 4 | 33 |
| Penn, W | 8 | 2.1 | 25 | 33 |
| Wisc, E | 7 | 2.1 | 33 | 33 |
| Hawaii | 3 | 2.1 | 52 | 33 |
| Oregon | 8 | 2.0 | 25 | 37 |
| Mich, E | 12 | 1.9 | 20 | 38 |
| Ga, S | 3 | 1.9 | 52 | 38 |
| R. I. | 2 | 1.9 | 62 | 38 |
| Ill, N | 17 | 1.8 | 9 | 41 |
| Cal, E | 14 | 1.8 | 12 | 41 |
| Texas, W | 12 | 1.7 | 20 | 43 |
| Mo, W | 5 | 1.6 | 42 | 44 |
| Miss, S | 3 | 1.6 | 52 | 44 |
| Minnesota | 8 | 1.5 | 25 | 46 |
| Ohio, N | 8 | 1.4 | 25 | 47 |
| Nevada | 4 | 1.4 | 46 | 47 |
| Virg, W | 3 | 1.4 | 52 | 47 |
| N. Y., S | 7 | 1.3 | 33 | 50 |
| Utah | 4 | 1.3 | 46 | 50 |
| Ken, W | 3 | 1.3 | 52 | 50 |
| Okla, E | 1 | 1.3 | 73 | 50 |
| Tenn, M | 3 | 1.2 | 52 | 54 |
| S Dakota | 1 | 1.2 | 73 | 54 |
| Iowa, S | 2 | 1.1 | 62 | 56 |
| Nebraska | 2 | 1.1 | 62 | 56 |
| W Virg, N | 1 | 1.1 | 73 | 56 |
| Cal, N | 8 | 1.0 | 25 | 59 |
| Ind, S | 4 | 1.0 | 46 | 59 |
| Ga, M | 2 | 1.0 | 62 | 59 |
| N. J. | 8 | 0.9 | 25 | 62 |
| Mass | 6 | 0.9 | 36 | 62 |
| Ohio, S | 5 | 0.9 | 42 | 62 |
| Mich, W | 3 | 0.9 | 52 | 62 |
| Tenn, E | 2 | 0.8 | 62 | 66 |
| Wisc, W | 2 | 0.8 | 62 | 66 |
| Iowa, N | 1 | 0.8 | 73 | 66 |
| New Hamp | 1 | 0.8 | 73 | 66 |
| N. Y., E | 6 | 0.7 | 36 | 70 |
| Wash, W | 4 | 0.7 | 46 | 70 |
| Virg, E | 4 | 0.6 | 46 | 72 |
| Ark, E | 1 | 0.6 | 73 | 72 |
| Idaho | 1 | 0.6 | 73 | 72 |
| La, E | 1 | 0.6 | 73 | 72 |
| Wash, E | 1 | 0.6 | 73 | 72 |
| Fla, M | 6 | 0.5 | 36 | 77 |
| Fla, N | 1 | 0.5 | 73 | 77 |
| Ken, E | 1 | 0.5 | 73 | 77 |
| S Car | 2 | 0.4 | 62 | 80 |
| Penn, E | 2 | 0.3 | 62 | 81 |
| Penn, M | 1 | 0.3 | 73 | 81 |
| Puer Rico | 27 | na | 2 | na |
| Virgin Is | 8 | na | 25 | na |
| Guam | 1 | na | 73 | na |
Footnotes
[1] See for example, The Washington Post article by Matt Zapotosky, "Inspector general faults DEA for seizing money without any connection to a larger criminal investigation," March 29, 2017, and The Atlantic article by Matt Ford, "Justice Thomas's Doubts About Civil Forfeiture," April 3, 2017.
Each month, TRAC offers a free report focused on one area of civil litigation in the U.S. district courts. In addition, subscribers to the TRACFed data service can generate custom reports by district, office, nature of suit or federal jurisdiction via the TRAC Data Interpreter.