Federal Labor Management Relations Litigation Down in Latest Figures for November 2016
The latest available data from the federal courts show that during November 2016 the government reported 47 new labor/management relations civil filings. According to the case-by- case information analyzed by the Transactional Records Access Clearinghouse (TRAC), this is below the filing rate seen during FY 2016 (ending in September), where lawsuits of this type averaged 57 per month. Five years ago, filings were twice November's level, averaging 98 per month.
| Latest month (November 2016) | 47 |
| Previous month (October 2016) | 46 |
| Number FY 2016 | 678 |
| Number FY 2011 | 1,179 |
| Percent change from 5 years ago | -42.5% |
The comparisons of the number of civil filings for labor/management relations-related suits are based on case-by-case court records which were compiled and analyzed by TRAC (see Table 1).
Labor management litigation often involves a labor union or employee pension or welfare fund suing a particular company in a contract or benefit dispute. Other times it may involve an employee suing the labor union or pension fund, although more often it is the company that is the party being sued.
The long term trend in labor/management relations civil filings for these matters going back five years is shown more clearly in Figure 1. The vertical bars in Figure 1 represent the number of labor/management relations civil filings of this type recorded each year. Figures for FY 2016 were down 42.5 percent from the number five years ago during FY 2011.
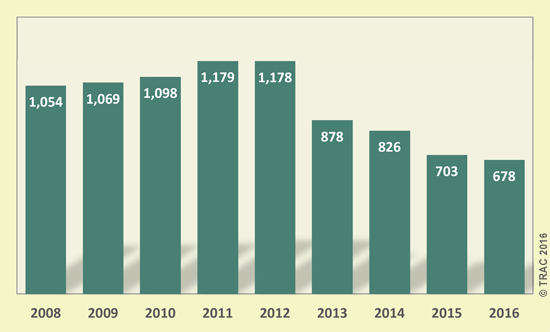
Figure 1. Federal Labor-Management Relations Litigation, FY 2008 - FY 2016
Top Ranked Judicial Districts
Litigation of this type is not evenly spread across the country. During all of fiscal year 2016, for example, filings relative to the population in each federal judicial district ranged widely. While the national average was 2.1 suits per million population, three districts had four or more times the level of this litigation than the national average.
The Southern District of New York (Manhattan) had both the highest number of these lawsuits (78) as well as the highest rate of litigation of this type at seven times the national average.
The Southern District of Ohio (Cincinnati) had the second highest rate. With 61 labor- management relations suits, it experienced five times the national average.
Much less populous Hawaii came in a surprising third in the level of this litigation relative to its population size. It had four times the national average rate for labor-management litigation.
While litigation fell in most districts over the past five years, the sharpest drop was experienced by New Jersey where the number of suits fell by 92 percent. The Northern District of West Virginia (Wheeling) had the next sharpest decline of 81 percent, closely followed by the Eastern District of Wisconsin (Milwaukee) where labor-management suits fell by 79 percent between FY 2011 and FY 2016.
Table 2 provides comparative numbers and rankings for labor-management cases for FY 2016 during FY 2016.
(click title to open in a new window)
| Ranking | ||||
|---|---|---|---|---|
| District | Number | Rate | Number | Rate |
| United States | 678 | 2.1 | ||
| N. Y., S | 78 | 14.9 | 1 | 1 |
| Ill, N | 67 | 7.2 | 2 | 5 |
| Ohio, S | 61 | 10.4 | 3 | 2 |
| Cal, C | 52 | 2.7 | 4 | 19 |
| Cal, N | 38 | 4.6 | 5 | 7 |
| N. Y., E | 33 | 4.0 | 6 | 9 |
| Ohio, N | 22 | 3.8 | 7 | 10 |
| Mass | 22 | 3.2 | 7 | 14 |
| N. J. | 22 | 2.5 | 7 | 21 |
| Ind, N | 17 | 6.6 | 10 | 6 |
| Mich, E | 16 | 2.5 | 11 | 21 |
| Wash, W | 14 | 2.5 | 12 | 21 |
| Hawaii | 12 | 8.4 | 13 | 3 |
| Maryland | 12 | 2.0 | 13 | 26 |
| Nevada | 11 | 3.8 | 15 | 10 |
| Ill, C | 10 | 4.5 | 16 | 8 |
| Mo, E | 10 | 3.4 | 16 | 12 |
| Penn, W | 9 | 2.4 | 18 | 25 |
| Mo, W | 8 | 2.5 | 19 | 21 |
| Penn, E | 8 | 1.4 | 19 | 32 |
| Conn | 7 | 1.9 | 21 | 27 |
| Cal, E | 7 | 0.9 | 21 | 42 |
| Ken, W | 6 | 2.7 | 23 | 19 |
| Mich, W | 6 | 1.7 | 23 | 28 |
| Texas, E | 6 | 1.6 | 23 | 30 |
| Minnesota | 6 | 1.1 | 23 | 38 |
| Virg, E | 6 | 1.0 | 23 | 40 |
| Fla, S | 6 | 0.8 | 23 | 49 |
| Texas, S | 6 | 0.6 | 23 | 57 |
| D. C. | 5 | 7.4 | 30 | 4 |
| Texas, N | 5 | 0.7 | 30 | 52 |
| Kansas | 4 | 1.4 | 32 | 32 |
| Oregon | 4 | 1.0 | 32 | 40 |
| W Virg, S | 3 | 3.3 | 34 | 13 |
| Delaware | 3 | 3.2 | 34 | 14 |
| W Virg, N | 3 | 3.2 | 34 | 14 |
| Montana | 3 | 2.9 | 34 | 17 |
| N Mexico | 3 | 1.4 | 34 | 32 |
| Cal, S | 3 | 0.9 | 34 | 42 |
| N. Y., N | 3 | 0.9 | 34 | 42 |
| Penn, M | 3 | 0.9 | 34 | 42 |
| Wisc, E | 3 | 0.9 | 34 | 42 |
| N Car, E | 3 | 0.8 | 34 | 49 |
| Ind, S | 3 | 0.7 | 34 | 52 |
| Alaska | 2 | 2.8 | 45 | 18 |
| Ala, M | 2 | 1.7 | 45 | 28 |
| Maine | 2 | 1.5 | 45 | 31 |
| Miss, S | 2 | 1.1 | 45 | 38 |
| Ken, E | 2 | 0.9 | 45 | 42 |
| Ala, N | 2 | 0.7 | 45 | 52 |
| N. Y., W | 2 | 0.7 | 45 | 52 |
| Utah | 2 | 0.7 | 45 | 52 |
| Colorado | 2 | 0.4 | 45 | 62 |
| Fla, M | 2 | 0.2 | 45 | 65 |
| Okla, E | 1 | 1.3 | 55 | 35 |
| Ala, S | 1 | 1.2 | 55 | 36 |
| La, M | 1 | 1.2 | 55 | 36 |
| R. I. | 1 | 0.9 | 55 | 42 |
| Ill, S | 1 | 0.8 | 55 | 49 |
| Ga, S | 1 | 0.6 | 55 | 57 |
| Wash, E | 1 | 0.6 | 55 | 57 |
| Ga, M | 1 | 0.5 | 55 | 60 |
| Nebraska | 1 | 0.5 | 55 | 60 |
| Tenn, M | 1 | 0.4 | 55 | 62 |
| Wisc, W | 1 | 0.4 | 55 | 62 |
| Ga, N | 1 | 0.2 | 55 | 65 |
| Arizona | 1 | 0.1 | 55 | 67 |
Each month, TRAC offers a free report focused on one area of civil litigation in the U.S. district courts. In addition, subscribers to the TRACFed data service can generate custom reports by district, office, nature of suit or federal jurisdiction via the TRAC Data Interpreter.