Federal Prisoner Petitions to Vacate Sentences Soar in 2016
The latest available data from the federal courts show that during July 2016 the government reported 1,432 new federal prisoner petitions to vacate their sentences were filed. This is the fourth month in a row that civil filings for these matters have been above a thousand. According to the case-by-case information analyzed by the Transactional Records Access Clearinghouse (TRAC) at Syracuse University, July's total was only topped by May and June of this year. In May 2016 there were a total of 2,767 prisoner sentence petitions, while in June there were a whopping 13,254.
Over the previous 5 years the number of such petitions filed each month averaged less than 600, and generally ranged between 450 and 700 each month based upon a comparisons of case-by-case court records going back to October 2007 that were compiled and analyzed by TRAC (see Table 1). Thus, the numbers seen so far this year are clearly unprecedented.
| Number Latest Month (July 2016) | 1,432 |
| Number June 2016 | 13,254 |
| Number May 2016 | 2,767 |
| Percent Change from 1 year ago | 690% |
| Percent Change from 5 years ago | 567% |
The annual trend for these matters going back through FY 2008 is shown more clearly in Figure 1. The vertical bars in Figure 1 represent the number of motions filed to vacate sentence of this type recorded in the U.S. district courts each fiscal year. On an annual basis, when fiscal year 2016 civil filings of this type are compared with those of the same period in the previous year, their number was up 391 percent. Similarly they were up 332 percent from levels of five years ago.
Comparisons based on the most recent six month period show an even higher jump. The average for the past six months was up 690 percent over the level one-year ago, and up 567 percent over five years ago. See Table 1.
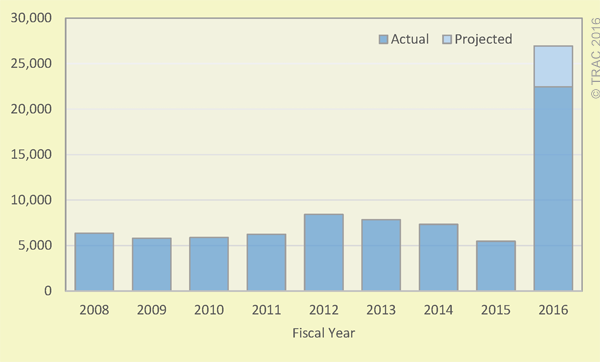
Figure 1. Number of Federal Prisoner Petitions to Vacate Sentences by Fiscal Year
Top and Bottom Ranked Judicial Districts
The Southern District of Florida (Miami) had the largest number of prisoner sentence petitions filed so far this past fiscal year with 1,259 in that one district alone. Relative to its population size, its per capita rank was sixth in the nation.
This compares to the District of Columbia which ranked first relative to its population size, but fell to 56th place in number of its suits. Relative to its population, the Northern District of Iowa (Cedar Rapids) was ranked second highest in the country. Both D.C. and Northern Iowa had rates of prisoner sentence filings that were, respectively, 3.0 and 2.7 times the national average.
The Eastern District of North Carolina (Raleigh) ranked third, relative to its population size in the number of prisoner sentence suits filed so far during FY 2016. In sheer numbers of suits filed it had 707. This also placed it fourth in the country based strictly on the volume of suits filed.
Relative to its population with a rate that was only one-fifth of the national average, the Central District of California (Los Angeles) ranked in last place. The Western District of Washington (Seattle) ranked next to last on its rate of prisoner sentence petitions.
For a complete listing of the number of prisoner sentence petitions filed so far this fiscal year in each of the 90 federal judicial districts, along with their rankings, see Table 2.
FY 2014 - FY 2016*
(click title to open in a new window)
| Number | Per Capita Rate (per million) | 2016 Rankings | ||||||
|---|---|---|---|---|---|---|---|---|
| Judicial District | FY 2014 | FY 2015 | FY 2016* | FY 2014 | FY 2015 | FY 2016* | Number | Rate |
| D. C. | 23 | 20 | 142 | 34.9 | 29.8 | 211.2 | 56 | 1 |
| Iowa, N | 70 | 42 | 247 | 52.8 | 31.6 | 185.9 | 30 | 2 |
| N Car, E | 191 | 150 | 707 | 48.8 | 38.0 | 179.0 | 4 | 3 |
| Tenn, E | 154 | 108 | 459 | 59.8 | 41.7 | 177.4 | 13 | 4 |
| N Car, M | 162 | 165 | 518 | 55.8 | 56.3 | 176.8 | 11 | 5 |
| Fla, S | 392 | 275 | 1,259 | 54.9 | 38.0 | 173.9 | 1 | 6 |
| Tenn, W | 108 | 74 | 254 | 68.5 | 47.0 | 161.3 | 29 | 7 |
| N Dakota | 25 | 35 | 117 | 33.8 | 46.2 | 154.6 | 63 | 8 |
| Iowa, S | 78 | 50 | 257 | 43.8 | 27.8 | 143.1 | 27 | 9 |
| Virg, W | 103 | 75 | 312 | 47.2 | 34.3 | 142.6 | 21 | 10 |
| Penn, E | 188 | 131 | 823 | 32.2 | 22.4 | 140.6 | 2 | 11 |
| N Car, W | 160 | 90 | 439 | 51.2 | 28.4 | 138.7 | 14 | 12 |
| S Car | 226 | 132 | 672 | 46.8 | 27.0 | 137.3 | 8 | 13 |
| W Virg, S | 29 | 23 | 122 | 31.6 | 25.2 | 133.7 | 60 | 14 |
| Mo, W | 95 | 83 | 415 | 30.3 | 26.4 | 131.9 | 15 | 15 |
| W Virg, N | 39 | 37 | 122 | 42.0 | 39.7 | 131.0 | 60 | 16 |
| Wyoming | 21 | 13 | 74 | 35.9 | 22.2 | 126.3 | 79 | 17 |
| Mo, E | 98 | 81 | 345 | 33.4 | 27.6 | 117.5 | 20 | 18 |
| Ga, S | 83 | 94 | 183 | 53.4 | 60.0 | 116.9 | 45 | 19 |
| Maryland | 229 | 137 | 694 | 38.3 | 22.8 | 115.5 | 5 | 20 |
| N Mexico | 39 | 38 | 233 | 18.7 | 18.2 | 111.7 | 36 | 21 |
| Ala, S | 44 | 29 | 93 | 52.4 | 34.4 | 110.3 | 71 | 22 |
| Ill, S | 63 | 58 | 138 | 49.5 | 45.7 | 108.8 | 58 | 23 |
| Montana | 50 | 35 | 110 | 48.9 | 33.9 | 106.5 | 65 | 24 |
| Ga, M | 41 | 52 | 208 | 20.4 | 25.9 | 103.5 | 39 | 25 |
| Fla, N | 103 | 66 | 189 | 57.0 | 36.2 | 103.5 | 42 | 25 |
| Virg, E | 189 | 121 | 625 | 30.8 | 19.5 | 100.9 | 10 | 27 |
| R. I. | 19 | 14 | 104 | 18.0 | 13.3 | 98.5 | 68 | 28 |
| Texas, N | 221 | 165 | 693 | 31.3 | 23.1 | 96.8 | 6 | 29 |
| Texas, W | 259 | 205 | 667 | 37.8 | 29.4 | 95.6 | 9 | 30 |
| N. Y., S | 165 | 127 | 479 | 31.6 | 24.2 | 91.2 | 12 | 31 |
| Ark, E | 29 | 25 | 148 | 17.7 | 15.2 | 90.2 | 53 | 32 |
| Kansas | 87 | 48 | 255 | 30.0 | 16.5 | 87.6 | 28 | 33 |
| Nevada | 54 | 31 | 245 | 19.0 | 10.7 | 84.8 | 31 | 34 |
| Ala, M | 34 | 30 | 97 | 29.6 | 26.0 | 84.1 | 70 | 35 |
| Penn, M | 52 | 44 | 263 | 16.4 | 13.8 | 82.7 | 25 | 36 |
| Tenn, M | 44 | 25 | 193 | 18.4 | 10.3 | 79.2 | 41 | 37 |
| Nebraska | 46 | 20 | 140 | 24.4 | 10.5 | 73.8 | 57 | 38 |
| Ind, N | 43 | 42 | 187 | 16.6 | 16.2 | 72.3 | 44 | 39 |
| Texas, S | 307 | 240 | 684 | 33.0 | 25.3 | 72.2 | 7 | 40 |
| La, E | 39 | 27 | 118 | 23.5 | 16.1 | 70.5 | 62 | 41 |
| Mich, W | 58 | 56 | 245 | 16.7 | 16.1 | 70.4 | 31 | 42 |
| Okla, W | 27 | 26 | 147 | 12.9 | 12.3 | 69.8 | 54 | 43 |
| Utah | 22 | 13 | 208 | 7.5 | 4.3 | 69.4 | 39 | 44 |
| Ind, S | 94 | 73 | 278 | 23.4 | 18.1 | 68.9 | 24 | 45 |
| Ill, C | 55 | 50 | 152 | 24.5 | 22.4 | 68.0 | 50 | 46 |
| S Dakota | 19 | 19 | 57 | 22.6 | 22.5 | 67.5 | 84 | 47 |
| Maine | 17 | 22 | 89 | 12.8 | 16.5 | 67.0 | 72 | 48 |
| Ken, E | 58 | 53 | 147 | 26.5 | 24.1 | 66.9 | 54 | 49 |
| Okla, N | 28 | 30 | 70 | 26.7 | 28.4 | 66.2 | 80 | 50 |
| Fla, M | 341 | 212 | 719 | 31.1 | 18.9 | 64.2 | 3 | 51 |
| Penn, W | 108 | 47 | 242 | 28.6 | 12.5 | 64.2 | 33 | 51 |
| Hawaii | 10 | 16 | 89 | 7.0 | 11.2 | 62.2 | 72 | 53 |
| Texas, E | 104 | 95 | 237 | 27.5 | 24.6 | 61.5 | 35 | 54 |
| Ohio, N | 77 | 79 | 350 | 13.4 | 13.8 | 60.9 | 17 | 55 |
| Ark, W | 33 | 24 | 80 | 24.9 | 17.9 | 59.8 | 77 | 56 |
| Vermont | 21 | 10 | 36 | 33.5 | 16.0 | 57.5 | 90 | 57 |
| Miss, S | 47 | 25 | 105 | 25.1 | 13.3 | 56.0 | 67 | 58 |
| Alaska | 14 | 12 | 40 | 19.6 | 16.8 | 55.8 | 87 | 59 |
| Ala, N | 68 | 33 | 159 | 23.8 | 11.5 | 55.5 | 49 | 60 |
| Miss, N | 18 | 14 | 61 | 16.1 | 12.5 | 54.5 | 83 | 61 |
| Cal, S | 99 | 46 | 189 | 28.7 | 13.2 | 54.3 | 42 | 62 |
| Oregon | 36 | 37 | 217 | 9.1 | 9.2 | 53.9 | 38 | 63 |
| Okla, E | 8 | 9 | 40 | 10.7 | 12.0 | 53.5 | 87 | 64 |
| Ga, N | 89 | 80 | 354 | 13.6 | 12.0 | 53.3 | 16 | 65 |
| Wash, E | 29 | 15 | 82 | 18.7 | 9.6 | 52.4 | 75 | 66 |
| Arizona | 207 | 132 | 347 | 30.8 | 19.3 | 50.8 | 19 | 67 |
| New Hamp | 9 | 9 | 66 | 6.8 | 6.8 | 49.6 | 81 | 68 |
| Mich, E | 80 | 87 | 288 | 12.4 | 13.5 | 44.7 | 22 | 69 |
| La, M | 18 | 14 | 37 | 21.8 | 16.9 | 44.6 | 89 | 70 |
| Delaware | 9 | 6 | 42 | 9.6 | 6.3 | 44.4 | 86 | 71 |
| La, W | 44 | 23 | 89 | 20.3 | 10.6 | 41.1 | 72 | 72 |
| N. Y., W | 39 | 34 | 115 | 13.8 | 12.1 | 40.9 | 64 | 73 |
| Conn | 45 | 28 | 137 | 12.5 | 7.8 | 38.2 | 59 | 74 |
| Ill, N | 130 | 106 | 350 | 13.9 | 11.3 | 37.4 | 17 | 75 |
| Ken, W | 39 | 23 | 82 | 17.5 | 10.3 | 36.8 | 75 | 76 |
| Mass | 53 | 44 | 229 | 7.8 | 6.5 | 33.7 | 37 | 77 |
| Wisc, E | 37 | 40 | 110 | 10.9 | 11.8 | 32.3 | 65 | 78 |
| Colorado | 39 | 37 | 173 | 7.3 | 6.8 | 31.7 | 47 | 79 |
| N. Y., E | 77 | 60 | 261 | 9.3 | 7.2 | 31.4 | 26 | 80 |
| Ohio, S | 52 | 41 | 178 | 8.9 | 7.0 | 30.3 | 46 | 81 |
| Minnesota | 51 | 40 | 151 | 9.3 | 7.3 | 27.5 | 51 | 82 |
| Idaho | 14 | 13 | 45 | 8.6 | 7.9 | 27.2 | 85 | 83 |
| N. J. | 104 | 105 | 240 | 11.6 | 11.7 | 26.8 | 34 | 84 |
| Wisc, W | 24 | 15 | 62 | 10.2 | 6.3 | 26.2 | 82 | 85 |
| N. Y., N | 45 | 26 | 78 | 13.1 | 7.6 | 22.8 | 78 | 86 |
| Cal, N | 37 | 33 | 167 | 4.5 | 4.0 | 20.1 | 48 | 87 |
| Cal, E | 53 | 33 | 151 | 6.7 | 4.1 | 19.0 | 51 | 88 |
| Wash, W | 55 | 29 | 100 | 10.0 | 5.2 | 17.8 | 69 | 89 |
| Cal, C | 133 | 106 | 281 | 6.9 | 5.5 | 14.5 | 23 | 90 |
Each month, TRAC offers a free report focused on one area of civil litigation in the U.S. district courts. In addition, subscribers to the TRACFed data service can generate custom reports by district, office, nature of suit or federal jurisdiction via the TRAC Data Interpreter.