Weapons Prosecutions for December 2023
The latest available data from the Justice Department show that during December 2023 the government reported 496 new weapons prosecutions. According to the case-by-case information analyzed by the Transactional Records Access Clearinghouse (TRAC), this number is down 8.3 percent over the previous month.
The comparisons of the number of defendants charged with weapons-related offenses are based on case-by-case information obtained by TRAC under the Freedom of Information Act from the Executive Office for United States Attorneys (see Table 1).
When monthly 2023 prosecutions of this type are compared with those of the same period in the previous year, the number of filings was down (-18.3%). Prosecutions over the past year are still much lower than they were five years ago. Overall, the data show that prosecutions of this type are down 29.3 percent from levels reported in 2018.
Figure 1. Monthly Trends in Weapons Prosecutions
The decrease from the levels five years ago in weapons prosecutions for these matters is shown more clearly in Figure 1. The vertical bars in Figure 1 represent the number of weapons prosecutions of this type recorded on a month-to-month basis. Where a prosecution was initially filed in U.S. Magistrate Court and then transferred to the U.S. District Court, the magistrate filing date was used since this provides an earlier indicator of actual trends. The superimposed line on the bars plots the six-month moving average so that natural fluctuations are smoothed out. The one and five-year rates of change in Table 1 and in the sections that follow are all based upon this six-month moving average. To view trends year-by-year rather than month-by-month, see TRAC's annual report series for a broader picture.
Within the broad category of weapons, cases were classified by prosecutors into more specific types.
Case types within weapons are
Armed Career Criminal Act
Firearms/Triggerlock
Other Operation Triggerlock Prosecutions
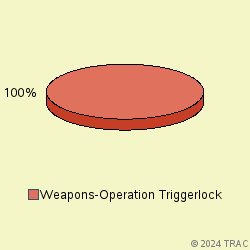
The largest number of prosecutions of these matters in December 2023 was for "Weapons-Operation Triggerlock Major", accounting for 100 percent of prosecutions. See Figure 2.
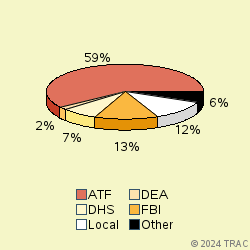
The lead investigative agency for weapons prosecutions in December 2023 was ATF accounting for 59 percent of prosecutions referred. Other agencies with substantial numbers of weapons referrals were: FBI (13% ), Local (12%), DHS (7%), DEA (2%). See Figure 3.
Weapons Prosecutions in U.S. Magistrate Courts
Top Ranked Lead Charges
In December 2023, 88 defendants in weapons cases for these matters were filed in U.S. Magistrate Courts. These courts handle less serious misdemeanor cases, including what are called "petty offenses." In addition, complaints are sometimes filed in the magistrate courts before an indictment or information is entered. In these cases, the matter starts in the magistrate courts and later moves to the district court where subsequent proceedings take place.
In the magistrate courts in December the most frequently cited lead charge was Title 18 U.S.C Section 922 involving "Firearms; Unlawful acts". This was the lead charge for 64.8 percent of all magistrate filings in December.
Other frequently prosecuted lead charges include: "Other US Code Section" (8%), "18 USC 554 - Smuggling goods from the United States" (5.7%).
Weapons Prosecutions in U.S. District Courts
In December 2023, 408 defendants in new cases for these matters were charged in the U.S. District Courts. In addition during December there were an additional 73 defendants whose cases moved from the magistrate courts to the U.S. district courts after an indictment or information was filed. The sections which follow cover both sets of cases and therefore cover all matters filed in district court during December.
Top Ranked Lead Charges
Table 2 shows the top lead charges recorded in the prosecutions of weapons matters filed in U.S. District Court during December 2023.
Lead Charge Count Rank 1yr ago 5yrs ago 18 USC 922 - Firearms; Unlawful acts 399 1 1 1 More 18 USC 554 - Smuggling goods from the United States 13 3 7 8 More 18 USC 924 - Firearms; Penalties 12 4 4 2 More 18 USC 371 - Conspiracy to commit offense or to defraud US 7 5 10 10 More 18 USC 1951 - Hobbs Act 7 5 5 3 More 21 USC 841 - Drug Abuse Prevention & Control-Prohibited acts A 6 7 3 5 More 26 USC 5861 - Tax on Making Firearms - Prohibited acts 5 8 6 7 More 08 USC 1326 - Reentry of deported alien 4 9 17 18 More 18 USC 2113 - Bank robbery and incidental crimes 4 9 12 11 More Table 2. Top Charges Filed
"Firearms; Unlawful acts" (Title 18 U.S.C Section 922) was the most frequent recorded lead charge. "Firearms; Unlawful acts" (Title 18 U.S.C Section 922) was ranked 1 a year ago, while it was ranked 1 five years ago.
Ranked 2nd in frequency was the lead charge "Other US Code Section" under Title U.S.C Section. "Other US Code Section" under Title U.S.C Section was ranked 2 a year ago, while it was ranked 4 five years ago.
Ranked 3rd was "Smuggling goods from the United States" under Title 18 U.S.C Section 554. "Smuggling goods from the United States" under Title 18 U.S.C Section 554 was ranked 7 a year ago, while it was ranked 8 five years ago.
Among these top ten lead charges, the one showing the greatest increase in prosecutions — up 213.3 percent — compared to one year ago was Title 18 U.S.C Section 371 that involves " Conspiracy to commit offense or to defraud US ". This was the same statute that had the largest increase — 193.8 % — when compared with five years ago.
Again among the top ten lead charges, the one showing the sharpest decline in prosecutions compared to one year ago — down 33 percent — was " Firearms; Penalties " (Title 18 U.S.C Section 924 ). This was the same statute that had the largest decrease — 63.4 % — when compared with five years ago.
Top Ranked Judicial Districts
In December 2023 the Justice Department's case-by-case records show that the government brought 173.2 weapons prosecutions for every ten million people in the United States.
Understandably, there is great variation in the per capita number of weapons prosecutions that are filed in each of the nation's ninety-four federal judicial districts.
The districts registering the largest number of prosecutions per capita for these matters last month are shown in Table 3. Districts must have at least 5 weapons prosecutions to receive a ranking.
Judicial District Percapita Count Rank 1yr ago 5yrs ago Ala, M 1,814 18 1 46 53 More Mo, E 1,689 41 2 1 1 More D. C. 1,250 7 3 42 51 More Iowa, N 991 11 4 23 30 More S Dakota 803 6 5 41 62 More Tenn, W 771 10 6 25 4 More Montana 748 7 7 47 50 More Ark, E 732 10 8 7 3 More Ala, N 556 14 9 22 11 More Iowa, S 514 8 10 38 36 More Table 3. Top 10 Districts (per ten million people)
The Middle District of Alabama (Montgomery) — with 1814 prosecutions as compared with 173.2 prosecutions per ten million population in the United States — was the most active during December 2023.
The Eastern District of Missouri (St. Louis) ranked 2nd. The Eastern District of Missouri (St. Louis) was ranked 1 a year ago, while it was ranked 1 for most frequent use five years ago.
District of Washington, D.C. (Washington) is now ranking 3rd.
Recent entrants to the top 10 list were Northern District of Alabama (Birmingham), now ranked 9th , and Northern District of Iowa (Cedar Rapids) at 4th In the same order, these districts ranked 22nd and 23rd one year ago and 11th and 30th five years ago.
The federal judicial district which showed the greatest growth in the rate of weapons prosecutions compared to one year ago — 50 percent — was Middle District of Alabama (Montgomery). This was the same district that had the largest increase — 58.3 percent — when compared with five years ago.
In the last year, the judicial District Court recording the largest drop in the rate of weapons prosecutions — 24.3 percent — was Eastern District of Missouri (St. Louis). But over the past five years, Western District of Tennessee (Memphis) showed the largest drop — 52 percent.
Top Ranked District Judges
At any one time, there are about 680 federal District Court judges working in the United States. The judges recorded with the largest number of new weapons crime cases of this type during December 2023 are shown in Table 4.
Judge Count Rank Coogler, L. Scott Ala, M 17 1 More Counts, Walter David, III Texas, W 10 2 More White, Ronnie Lee Mo, E 9 3 More Autrey, Henry Edward Mo, E 7 4 More Barber, Thomas Patrick Fla, M 6 5 More Sippel, Rodney W. Mo, E 6 5 More Torresen, Nancy Maine 5 7 More Campbell, David G. Arizona 4 8 More Doughty, Terry Alvin La, W 4 8 More Jonker, Robert James Mich, W 4 8 More Sachs, Howard Frederic Mo, W 4 8 More Watters, Susan Pamela Montana 4 8 More Bell, Kenneth Davis, Sr. N Car, W 4 8 More Pepper, Pamela Wisc, E 4 8 More Table 4. Top Ten Judges
A total of 5 out of the "top ten" judges were in districts which were in the top ten with the largest number of weapons filings per capita, while the remaining 9 judges were from other districts. (Because of ties, there were a total of 14 judges in the "top ten" rankings.)
Judge L. Scott Coogler in the Middle District of Alabama (Montgomery) ranked 1st with 17 defendants in weapons cases.
Judge Walter David Counts, III in the Western District of Texas (San Antonio) ranked 2nd with 10 defendants in weapons cases.
Judge Ronnie Lee White in the Eastern District of Missouri (St. Louis) ranked 3rd with 9 defendants in weapons cases.
Report Generated: February 7, 2024