Prosecutions for March 2021
Referring Agency: Internal Revenue Service
The latest available data from the Justice Department show that during March 2021 the government reported 80 new prosecutions for these matters. Those cases were referred by the Internal Revenue Service. According to the case-by-case information analyzed by the Transactional Records Access Clearinghouse (TRAC), this number is up 56.9 percent over the previous month.
The comparisons of the number of defendants charged are based on case-by-case information obtained by TRAC under the Freedom of Information Act from the Executive Office for United States Attorneys (see Table 1).
When monthly 2021 prosecutions of this type are compared with those of the same period in the previous year, the number of filings was down (-14.3%). Prosecutions over the past year are still much lower than they were five years ago. Overall, the data show that prosecutions of this type are down 52.8 percent from levels reported in 2016.
Figure 1. Monthly Trends in Prosecutions
The decrease from the levels five years ago in prosecutions for these matters is shown more clearly in Figure 1. The vertical bars in Figure 1 represent the number of prosecutions of this type recorded on a month-to-month basis. Where a prosecution was initially filed in U.S. Magistrate Court and then transferred to the U.S. District Court, the magistrate filing date was used since this provides an earlier indicator of actual trends. The superimposed line on the bars plots the six-month moving average so that natural fluctuations are smoothed out. The one and five-year rates of change in Table 1 and in the sections that follow are all based upon this six-month moving average. To view trends year-by-year rather than month-by-month, see TRAC's annual report series for a broader picture.
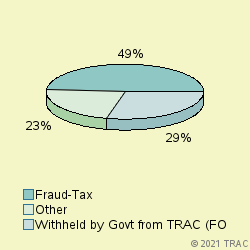
Cases were classified by prosecutors into more specific types.
The largest number of prosecutions of these matters in March 2021 was for "Fraud-Tax", accounting for 48.8 percent of prosecutions. Prosecutions were also filed for "Withheld by Govt from TRAC (FOIA challen" (28.8%), "Fraud-Other" (3.8%), "Drugs-Organized Crime Task Force" (2.5%), "Fraud-Computer" (2.5%), "Fraud-Federal Program" (2.5%), "Fraud-Financial Institution" (2.5%). See Figure 2.
Prosecutions in U.S. Magistrate Courts
Top Ranked Lead Charges
In March 2021, 9 defendants in cases for these matters were filed in U.S. Magistrate Courts. These courts handle less serious misdemeanor cases, including what are called "petty offenses." In addition, complaints are sometimes filed in the magistrate courts before an indictment or information is entered. In these cases, the matter starts in the magistrate courts and later moves to the district court where subsequent proceedings take place.
In the magistrate courts in March the most frequently cited lead charge was involving "&mg_pos1_uscdescription.". This was the lead charge for percent of all magistrate filings in March.
Prosecutions in U.S. District Courts
In March 2021, 71 defendants in new cases for these matters were charged in the U.S. District Courts. In addition during March there were an additional 3 defendants whose cases moved from the magistrate courts to the U.S. district courts after an indictment or information was filed. The sections which follow cover both sets of cases and therefore cover all matters filed in district court during March.
Top Ranked Lead Charges
Table 2 shows the top lead charges recorded in the prosecutions of matters filed in U.S. District Court during March 2021 referred by the Internal Revenue Service.
Lead Charge Count Rank 26 USC 7201 - Attempt to evade or defeat tax 19 1 More 26 USC 7206 - Fraud and False statements 16 2 More 18 USC 1343 - Fraud by wire, radio, or television 5 3 More 26 USC 7202 - Willful failure to collect or pay over tax 4 4 More 18 USC 1341 - Mail Fraud - Frauds and swindles 2 5 More 18 USC 286 - Conspiracy to defraud the Government claims 1 6 More 18 USC 287 - False, fictitious or fraudulent claims 1 6 More 18 USC 371 - Conspiracy to commit offense or to defraud US 1 6 More 18 USC 641 - Public money, property or records 1 6 More 18 USC 666 - Theft or bribery in programs receiving Fed funds 1 6 More 18 USC 1028A - Aggravated Identity Theft 1 6 More 18 USC 1030 - Fraud and related activity - computers 1 6 More 18 USC 1040 - Fraud in connection with major disaster or emergency benefits 1 6 More 18 USC 1349 - Mail Fraud - Attempt and Conspiracy 1 6 More 18 USC 1956 - Laundering of monetary instruments 1 6 More 21 USC 841 - Drug Abuse Prevention & Control-Prohibited acts A 1 6 More 21 USC 846 - Attempt and conspiracy 1 6 More 26 USC 7203 - Willful failure to file return, supply information 1 6 More 31 USC 5324 - Structuring transactions to evade reporting requir 1 6 More Table 2. Top Charges Filed
"Attempt to evade or defeat tax" (Title 26 U.S.C Section 7201) was the most frequent recorded lead charge.
Ranked 2nd in frequency was the lead charge "Fraud and False statements" under Title 26 U.S.C Section 7206.
Ranked 3rd was "Fraud by wire, radio, or television" under Title 18 U.S.C Section 1343.
Top Ranked Judicial Districts
In March 2021 the Justice Department's case-by-case records show that the government brought 27.1 prosecutions for every ten million people in the United States.
Understandably, there is great variation in the number of prosecutions that are filed in each of the nation's ninety-four federal judicial districts.
The districts registering the largest number of prosecutions of this type last month are shown in Table 3.
Judicial District Count Rank Fla, S 8 1 More Cal, C 6 2 More Minnesota 3 3 More N. J. 3 3 More Ohio, S 3 3 More Ala, N 2 6 More Ark, W 2 6 More Cal, E 2 6 More Conn 2 6 More Fla, M 2 6 More Ga, N 2 6 More La, E 2 6 More Maryland 2 6 More Mass 2 6 More N Mexico 2 6 More N. Y., S 2 6 More Nebraska 2 6 More Virg, W 2 6 More Wyoming 2 6 More Table 3. Top 10 Districts
The Southern District of Florida (Miami) — with 8 prosecutions — was the most active during March 2021.
The Central District of California (Los Angeles) ranked 2nd.
District of Minnesota, District of New Jersey and Southern District of Ohio (Cincinnati) are now ranking 3rd.
Top Ranked District Judges
At any one time, there are about 680 federal District Court judges working in the United States. The judges recorded with the largest number of new crime cases of this type during March 2021 are shown in Table 4.
Judge Count Rank Selna, James V. Cal, C 3 1 More Mueller, Kimberly Jo Cal, E 2 2 More Middlebrooks, Donald M. Fla, S 2 2 More Grimm, Paul W. Maryland 2 2 More Jones, James Parker Virg, W 2 2 More Kallon, Abdul Karim Ala, N 1 6 More Brooks, Timothy Lloyd Ark, W 1 6 More Wilson, Stephen Victor Cal, C 1 6 More Walter, John F. Cal, C 1 6 More Wu, George H. Cal, C 1 6 More Arguello, Christine M. Colorado 1 6 More Underhill, Stefan R. Conn 1 6 More Bolden, Victor Allen Conn 1 6 More Bucklew, Susan C. Fla, M 1 6 More Honeywell, Charlene Vanessa Edwards Fla, M 1 6 More Ungaro, Ursula Mancusi Fla, S 1 6 More Scola, Robert Nichols, Jr. Fla, S 1 6 More Rosenberg, Robin Lee Fla, S 1 6 More Altman, Roy Kalman Fla, S 1 6 More Brown, Michael Lawrence Ga, N 1 6 More Nye, David Charles Idaho 1 6 More Collins, Susan L. Ind, N 1 6 More Barbier, Carl J. La, E 1 6 More Walter, Donald Ellsworth La, W 1 6 More Saris, Patti B. Mass 1 6 More Saylor, F. Dennis, IV Mass 1 6 More Ludington, Thomas Lamson Mich, E 1 6 More Maloney, Paul Lewis Mich, W 1 6 More Montgomery, Ann D. Minnesota 1 6 More Brasel, Nancy Ellen Minnesota 1 6 More Tostrud, Eric Christian Minnesota 1 6 More Autrey, Henry Edward Mo, E 1 6 More Johnson, William Paul N Mexico 1 6 More Riggs, Kea W. N Mexico 1 6 More Chesler, Stanley R. N. J. 1 6 More Shipp, Michael A. N. J. 1 6 More McNulty, Kevin Charles N. J. 1 6 More Kahn, Lawrence E. N. Y., N 1 6 More Carter, Andrew L., Jr. N. Y., S 1 6 More Vyskocil, Mary Kay N. Y., S 1 6 More Gerrard, John Melvin Nebraska 1 6 More Bazis, Susan M. Nebraska 1 6 More Sargus, Edmund A., Jr. Ohio, S 1 6 More Barrett, Michael Ryan Ohio, S 1 6 More Dowdell, John Edward Okla, N 1 6 More Immergut, Karin Johanna Oregon 1 6 More Slomsky, Joel Harvey Penn, E 1 6 More Hanen, Andrew S. Texas, S 1 6 More Coughenour, John C. Wash, W 1 6 More Peterson, James Donald Wisc, W 1 6 More Johnson, Alan Bond Wyoming 1 6 More Freudenthal, Nancy Dell Wyoming 1 6 More Table 4. Top Ten Judges
A total of 38 out of the "top ten" judges were in districts which were in the top ten with the largest number of filings , while the remaining 14 judges were from other districts. (Because of ties, there were a total of 52 judges in the "top ten" rankings.)
Judge James V. Selna in the Central District of California (Los Angeles) ranked 1st with 3 defendants in cases.
Judges Kimberly Jo Mueller in the Eastern District of California (Sacramento), Donald M. Middlebrooks in the Southern District of Florida (Miami), Paul W. Grimm in the District of Maryland and James Parker Jones in the Western District of Virginia (Roanoke) ranked 2nd with 2 defendants in cases.
Report Generated: April 29, 2021