Prosecutions for February 2019
Referring Agency: Internal Revenue Service
The latest available data from the Justice Department show that during February 2019 the government reported 71 new prosecutions for these matters. Those cases were referred by the Internal Revenue Service. According to the case-by-case information analyzed by the Transactional Records Access Clearinghouse (TRAC), this number is down 2.7 percent over the previous month.
The comparisons of the number of defendants charged are based on case-by-case information obtained by TRAC under the Freedom of Information Act from the Executive Office for United States Attorneys (see Table 1).
When monthly 2019 prosecutions of this type are compared with those of the same period in the previous year, the number of filings was up (8.6%). Prosecutions over the past year are still much lower than they were five years ago. Overall, the data show that prosecutions of this type are down 51.3 percent from levels reported in 2014.
Figure 1. Monthly Trends in Prosecutions
The decrease from the levels five years ago in prosecutions for these matters is shown more clearly in Figure 1. The vertical bars in Figure 1 represent the number of prosecutions of this type recorded on a month-to-month basis. Where a prosecution was initially filed in U.S. Magistrate Court and then transferred to the U.S. District Court, the magistrate filing date was used since this provides an earlier indicator of actual trends. The superimposed line on the bars plots the six-month moving average so that natural fluctuations are smoothed out. The one and five-year rates of change in Table 1 and in the sections that follow are all based upon this six-month moving average. To view trends year-by-year rather than month-by-month, see TRAC's annual report series for a broader picture.
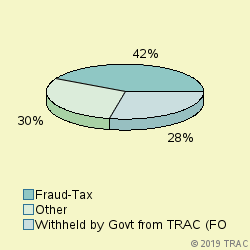
Cases were classified by prosecutors into more specific types.
The largest number of prosecutions of these matters in February 2019 was for "Fraud-Tax", accounting for 42.3 percent of prosecutions. Prosecutions were also filed for "Withheld by Govt from TRAC (FOIA challen" (28.2%), "Fraud-Other" (15.5%), "Money Laundering-Drug" (4.2%), "Drugs-Organized Crime Task Force" (2.8%), "Other Criminal Prosecutions" (2.8%). See Figure 2.
Prosecutions in U.S. Magistrate Courts
Top Ranked Lead Charges
In February 2019, 4 defendants in cases for these matters were filed in U.S. Magistrate Courts. These courts handle less serious misdemeanor cases, including what are called "petty offenses." In addition, complaints are sometimes filed in the magistrate courts before an indictment or information is entered. In these cases, the matter starts in the magistrate courts and later moves to the district court where subsequent proceedings take place.
In the magistrate courts in February the most frequently cited lead charge was Title 18 U.S.C Section 201 involving "Bribery of public officials and witnesses". This was the lead charge for 25 percent of all magistrate filings in February.
Prosecutions in U.S. District Courts
In February 2019, 67 defendants in new cases for these matters were charged in the U.S. District Courts. In addition during February there were an additional 1 defendants whose cases moved from the magistrate courts to the U.S. district courts after an indictment or information was filed. The sections which follow cover both sets of cases and therefore cover all matters filed in district court during February.
Top Ranked Lead Charges
Table 2 shows the top lead charges recorded in the prosecutions of matters filed in U.S. District Court during February 2019 referred by the Internal Revenue Service.
Lead Charge Count Rank 26 USC 7206 - Fraud and False statements 10 1 More 26 USC 7201 - Attempt to evade or defeat tax 9 2 More 18 USC 1956 - Laundering of monetary instruments 5 3 More 18 USC 371 - Conspiracy to commit offense or to defraud US 4 4 More 18 USC 287 - False, fictitious or fraudulent claims 3 5 More 31 USC 5324 - Structuring transactions to evade reporting requir 3 5 More 18 USC 286 - Conspiracy to defraud the Government claims 2 7 More 18 USC 1343 - Fraud by wire, radio, or television 2 7 More 18 USC 1344 - Bank Fraud 2 7 More 21 USC 846 - Attempt and conspiracy 2 7 More 26 USC 7202 - Willful failure to collect or pay over tax 2 7 More Table 2. Top Charges Filed
"Fraud and False statements" (Title 26 U.S.C Section 7206) was the most frequent recorded lead charge.
Ranked 2nd in frequency was the lead charge "Attempt to evade or defeat tax" under Title 26 U.S.C Section 7201.
Ranked 3rd was "Laundering of monetary instruments" under Title 18 U.S.C Section 1956.
Top Ranked Judicial Districts
In February 2019 the Justice Department's case-by-case records show that the government brought 25.1 prosecutions for every ten million people in the United States.
Understandably, there is great variation in the number of prosecutions that are filed in each of the nation's ninety-four federal judicial districts.
The districts registering the largest number of prosecutions of this type last month are shown in Table 3.
The Southern District of Florida (Miami) — with 9 prosecutions — was the most active during February 2019.
The Middle District of Florida (Tampa) ranked 2nd.
Eastern District of Michigan (Detroit) is now ranking 3rd.
Top Ranked District Judges
At any one time, there are about 680 federal District Court judges working in the United States. The judges recorded with the largest number of new crime cases of this type during February 2019 are shown in Table 4.
Judge Count Rank Ungaro, Ursula Mancusi Fla, S 3 1 More Du, Miranda Mai Nevada 3 1 More Burgess, Timothy Mark Alaska 2 3 More Wilson, Stephen Victor Cal, C 2 3 More Howard, Marcia Morales Fla, M 2 3 More Cooke, Marcia G. Fla, S 2 3 More Rosenberg, Robin Lee Fla, S 2 3 More Barbier, Carl J. La, E 2 3 More Battani, Marianne O. Mich, E 2 3 More Levy, Judith Ellen Mich, E 2 3 More Graham, James L. Ohio, S 2 3 More Munley, James Martin Penn, M 2 3 More Dillon, Elizabeth Kay Virg, W 2 3 More Table 4. Top Ten Judges
All 13 of the "top ten" judges were in districts which were in the top ten with the largest number of filings. (Because of ties, there were a total of 13 judges in the "top ten" rankings.)
Judges Ursula Mancusi Ungaro in the Southern District of Florida (Miami) and Miranda Mai Du in the District of Nevada ranked 1st with 3 defendants in cases.
Judges Timothy Mark Burgess in the District of Alaska, Stephen Victor Wilson in the Central District of California (Los Angeles), Marcia Morales Howard in the Middle District of Florida (Tampa), Marcia G. Cooke in the Southern District of Florida (Miami), Robin Lee Rosenberg in the Southern District of Florida (Miami), Carl J. Barbier in the Eastern District of Louisiana (New Orleans), Marianne O. Battani in the Eastern District of Michigan (Detroit), Judith Ellen Levy in the Eastern District of Michig ranked 3rd with 2 defendants in cases.
Report Generated: March 27, 2019