Government Regulatory Prosecutions for February 2024
The latest available data from the Justice Department show that during February 2024 the government reported 58 new government regulatory prosecutions. According to the case-by-case information analyzed by the Transactional Records Access Clearinghouse (TRAC), this number is down 38.3 percent over the previous month.
The comparisons of the number of defendants charged with government regulatory-related offenses are based on case-by-case information obtained by TRAC under the Freedom of Information Act from the Executive Office for United States Attorneys (see Table 1).
When monthly 2024 prosecutions of this type are compared with those of the same period in the previous year, the number of filings was up (4.6%). Prosecutions over the past year are still much lower than they were five years ago. Overall, the data show that prosecutions of this type are down 27.6 percent from levels reported in 2019.
Figure 1. Monthly Trends in Government Regulatory Prosecutions
The decrease from the levels five years ago in government regulatory prosecutions for these matters is shown more clearly in Figure 1. The vertical bars in Figure 1 represent the number of government regulatory prosecutions of this type recorded on a month-to-month basis. Where a prosecution was initially filed in U.S. Magistrate Court and then transferred to the U.S. District Court, the magistrate filing date was used since this provides an earlier indicator of actual trends. The superimposed line on the bars plots the six-month moving average so that natural fluctuations are smoothed out. The one and five-year rates of change in Table 1 and in the sections that follow are all based upon this six-month moving average. To view trends year-by-year rather than month-by-month, see TRAC's annual report series for a broader picture.
Within the broad category of government regulatory, cases were classified by prosecutors into more specific types.
Case types within government regulatory are
Counterfeiting and Forgery
Customs Violations - Duty
Customs Violations - Currency
Energy Pricing and Related Fraud
Health and Safety Violations - Employees
Health and Safety Violations - General Public
Copyright Violations
Trafficking in Contraband Cigarettes
Energy Violations - Nuclear Waste Issues
Money Laundering/Structuring (Narcotics)
Money Laundering/Structuring (Other)
Export Enforcement General
Other Government Regulatory Offenses
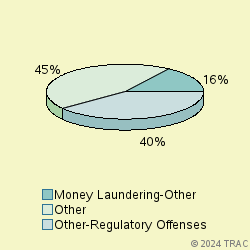
The largest number of prosecutions of these matters in February 2024 was for "Other-Regulatory Offenses", accounting for 39.7 percent of prosecutions. Prosecutions were also filed for "Money Laundering-Other" (15.5%), "Money Laundering-Drug" (13.8%), "Export Enforcement General" (12.1%), "Customs-Currency Violations" (8.6%), "Counterfeiting and Forgery" (3.4%), "Customs-Duty Violations" (3.4%), "Health and Safety Violations-Employees" (3.4%). See Figure 2.
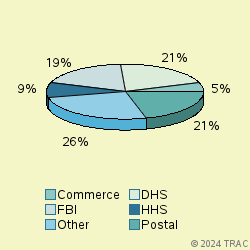
The lead investigative agency for government regulatory prosecutions in February 2024 was DHS accounting for 21 percent of prosecutions referred. Other agencies with substantial numbers of government regulatory referrals were: Postal (21% ), FBI (19%), HHS (9%), Commerce (5%). See Figure 3.
Government Regulatory Prosecutions in U.S. Magistrate Courts
Top Ranked Lead Charges
In February 2024, 24 defendants in government regulatory cases for these matters were filed in U.S. Magistrate Courts. These courts handle less serious misdemeanor cases, including what are called "petty offenses." In addition, complaints are sometimes filed in the magistrate courts before an indictment or information is entered. In these cases, the matter starts in the magistrate courts and later moves to the district court where subsequent proceedings take place.
In the magistrate courts in February the most frequently cited lead charge was Title 43 U.S.C Section . involving "Parking Violation". This was the lead charge for 41.7 percent of all magistrate filings in February.
Government Regulatory Prosecutions in U.S. District Courts
In February 2024, 34 defendants in new cases for these matters were charged in the U.S. District Courts. In addition during February there were an additional 6 defendants whose cases moved from the magistrate courts to the U.S. district courts after an indictment or information was filed. The sections which follow cover both sets of cases and therefore cover all matters filed in district court during February.
Top Ranked Lead Charges
Table 2 shows the top lead charges recorded in the prosecutions of government regulatory matters filed in U.S. District Court during February 2024.
Lead Charge Count Rank 18 USC 1343 - Fraud by wire, radio, or television 8 1 More 18 USC 1956 - Laundering of monetary instruments 7 2 More 31 USC 5332 - Bulk Cash Smuggling into or out of the United States 5 3 More 15 USC 1705 - Information required in statement of record 3 4 More 16 USC 3372 - Illegally Taken Fish & Wildlife - prohibited acts 2 5 More 18 USC 472 - Uttering counterfeit obligations or securities 2 5 More 18 USC 554 - Smuggling goods from the United States 2 5 More 18 USC 1960 - Prohibition of illegal money transmitting business 2 5 More 21 USC 331 - Fed Food, Drug & Cosmetics Act - Prohibited acts 2 5 More 50 USC 1705 - International Emergency Economic Powers 2 5 More Table 2. Top Charges Filed
"Fraud by wire, radio, or television" (Title 18 U.S.C Section 1343) was the most frequent recorded lead charge.
Ranked 2nd in frequency was the lead charge "Laundering of monetary instruments" under Title 18 U.S.C Section 1956.
Ranked 3rd was "Bulk Cash Smuggling into or out of the United States" under Title 31 U.S.C Section 5332.
Top Ranked Judicial Districts
In February 2024 the Justice Department's case-by-case records show that the government brought 14.4 government regulatory prosecutions for every ten million people in the United States.
Understandably, there is great variation in the number of government regulatory prosecutions that are filed in each of the nation's ninety-four federal judicial districts.
The districts registering the largest number of prosecutions of this type last month are shown in Table 3.
The District of New Jersey — with 6 prosecutions — was the most active during February 2024.
The Middle District of Georgia (Macon) ranked 2nd.
Southern District of New York (Manhattan) is now ranking 3rd.
Top Ranked District Judges
At any one time, there are about 680 federal District Court judges working in the United States. The judges recorded with the largest number of new government regulatory crime cases of this type during February 2024 are shown in Table 4.
Judge Count Rank Sands, W[illie] Louis Ga, M 5 1 More Salas, Esther N. J. 3 2 More Rayes, Douglas Leroy Arizona 2 3 More Kollar-Kotelly, Colleen D. C. 2 3 More Nye, David Charles Idaho 2 3 More Bartle, Harvey, III Penn, E 2 3 More Bailey, John Preston W Virg, N 2 3 More Snow, G. Murray Arizona 1 8 More Cecchi, Claire Claudia N. J. 1 8 More Reyes, Ramon E., Jr. N. Y., E 1 8 More Donnelly, Ann Marie N. Y., E 1 8 More Vyskocil, Mary Kay N. Y., S 1 8 More Carreño-Coll, Silvia Luisa Puer Rico 1 8 More Delgado Hernandez, Pedro Alberto Puer Rico 1 8 More Ellison, Keith P. Texas, S 1 8 More Cardone, Kathleen Texas, W 1 8 More Counts, Walter David, III Texas, W 1 8 More Pitman, Robert Texas, W 1 8 More Volk, Frank William W Virg, S 1 8 More Table 4. Top Ten Judges
A total of 17 out of the "top ten" judges were in districts which were in the top ten with the largest number of government regulatory filings , while the remaining 2 judges were from other districts. (Because of ties, there were a total of 19 judges in the "top ten" rankings.)
Judge W[illie] Louis Sands in the Middle District of Georgia (Macon) ranked 1st with 5 defendants in government regulatory cases.
Judge Esther Salas in the District of New Jersey ranked 2nd with 3 defendants in government regulatory cases.
Judges Douglas Leroy Rayes in the District of Arizona, Colleen Kollar-Kotelly in the District of Washington, D.C. (Washington), David Charles Nye in the District of Idaho, Harvey Bartle, III in the Eastern District of Pennsylvania (Philadelphia) and John Preston Bailey in the Northern District of West Virginia (Wheeling) ranked 3rd with 2 defendants in government regulatory cases.
Report Generated: April 3, 2024