Convictions for April 2019
The latest available data from the Justice Department show that during April 2019 the government reported 13146 new convictions. According to the case-by-case information analyzed by the Transactional Records Access Clearinghouse (TRAC), this number is down 6.2 percent over the previous month.
The comparisons of the number of defendants convicted are based on case-by-case information obtained by TRAC under the Freedom of Information Act from the Executive Office for United States Attorneys (see Table 1).
When monthly 2019 convictions of this type are compared with those of the same period in the previous year, the number of convictions was up (40.5%). Convictions over the past year are still much higher than they were five years ago. Overall, the data show that convictions of this type are up 17.2 percent from levels reported in 2014.
Figure 1. Monthly Trends in Convictions
The increase from the levels five years ago in convictions for these matters is shown more clearly in Figure 1. The vertical bars in Figure 1 represent the number of convictions of this type recorded on a month-to-month basis. Where a prosecution was initially filed in U.S. Magistrate Court and then transferred to the U.S. District Court, the magistrate filing date was used since this provides an earlier indicator of actual trends. The superimposed line on the bars plots the six-month moving average so that natural fluctuations are smoothed out. The one and five-year rates of change in Table 1 and in the sections that follow are all based upon this six-month moving average. To view trends year-by-year rather than month-by-month, see TRAC's annual report series for a broader picture.
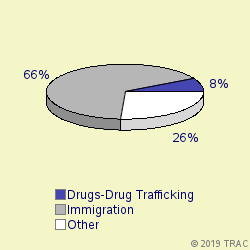
Cases were classified by prosecutors into more specific types.
The largest number of convictions of these matters in April 2019 was for "Immigration", accounting for 66 percent of convictions. Convictions were also filed for "Drugs-Drug Trafficking" (8.1%), "Weapons-Operation Triggerlock Major" (6.1%), "Drugs-Organized Crime Task Force" (4.3%), "Withheld by Govt from TRAC (FOIA challen" (2.8%). See Figure 2.
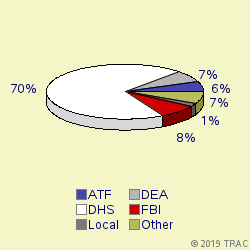
The lead investigative agency for convictions in April 2019 was DHS accounting for 70 percent of convictions. Other agencies with substantial numbers of convictions were: FBI (8% ), DEA (7%), ATF (6%), Local (1%). See Figure 3.
Convictions in U.S. Magistrate Courts
Top Ranked Lead Charges
In April 2019, 6370 defendants were convicted in U.S. Magistrate Courts. These courts handle less serious misdemeanor cases, including what are called "petty offenses." In addition, complaints are sometimes filed in the magistrate courts before an indictment or information is entered. In these cases, the matter starts in the magistrate courts and later moves to the district court where subsequent proceedings take place.
In the magistrate courts in April the most frequently cited lead charge was Title 8 U.S.C Section 1325 involving "Entry of alien at improper time or place; etc.". This was the lead charge for 80.2 percent of all magistrate convictions in April.
Other frequently prosecuted lead charges include: "08 USC 1326 - Reentry of deported alien" (15.5%).
Convictions in U.S. District Courts
In April 2019, 6776 defendants in new cases for these matters were charged in the U.S. District Courts. In addition during April there were an additional 0 defendants whose cases moved from the magistrate courts to the U.S. district courts after an indictment or information was filed. The sections which follow cover both sets of cases and therefore cover all matters filed in district court during April.
Top Ranked Lead Charges
Table 2 shows the top lead charges recorded in the convictions of matters filed in U.S. District Court during April 2019.
Lead Charge Count Rank 1yr ago 5yrs ago 08 USC 1326 - Reentry of deported alien 1,999 1 1 1 More 21 USC 841 - Drug Abuse Prevention & Control-Prohibited acts A 808 2 2 2 More 18 USC 922 - Firearms; Unlawful acts 716 3 3 4 More 21 USC 846 - Attempt and conspiracy 552 4 4 3 More 08 USC 1324 - Bringing in and harboring certain aliens 360 5 5 5 More 21 USC 952 - Importation of controlled substances 138 6 7 6 More 18 USC 2252 - Material involving sexual exploitation of minors 108 7 8 7 More 18 USC 1343 - Fraud by wire, radio, or television 107 8 9 9 More 18 USC 1951 - Hobbs Act 84 9 14 15 More 18 USC 2113 - Bank robbery and incidental crimes 69 10 10 10 More Table 2. Top Charges for Convictions
"Reentry of deported alien" (Title 8 U.S.C Section 1326) was the most frequent recorded lead charge. "Reentry of deported alien" (Title 8 U.S.C Section 1326) was ranked 1 a year ago, while it was ranked 1 five years ago.
Ranked 2nd in frequency was the lead charge "Drug Abuse Prevention & Control-Prohibited acts A" under Title 21 U.S.C Section 841. "Drug Abuse Prevention & Control-Prohibited acts A" under Title 21 U.S.C Section 841 was ranked 2 a year ago, while it was ranked 2 five years ago.
Ranked 3rd was "Firearms; Unlawful acts" under Title 18 U.S.C Section 922. "Firearms; Unlawful acts" under Title 18 U.S.C Section 922 was ranked 3 a year ago, while it was ranked 4 five years ago.
Among these top ten lead charges, the one showing the greatest increase in convictions — up 111.4 percent — compared to one year ago was Title U.S.C Section that involves "Other US Code Section ". This was the same statute that had the largest increase — 369.8 % — when compared with five years ago.
Again among the top ten lead charges, the one showing the sharpest decline in convictions compared to one year ago — down 3.7 percent — was " Bank robbery and incidental crimes " (Title 18 U.S.C Section 2113 ). Compared to five years ago, the most significant decline in convictions — 27.9 percent — was for convictions where the lead charge was " Attempt and conspiracy " (Title 21 U.S.C Section 846 ).
Top Ranked Judicial Districts
In April 2019 the Justice Department's case-by-case records show that the government obtained 2496.4 convictions for every ten million people in the United States.
Understandably, there is great variation in the per capita number of convictions in each of the nation's ninety-four federal judicial districts.
The districts registering the largest number of convictions per capita for these matters last month are shown in Table 3. Districts must have at least 5 convictions to receive a ranking.
Judicial District Percapita Count Rank 1yr ago 5yrs ago N Mexico 24,367 424 1 4 5 More Texas, W 16,505 993 2 1 1 More Cal, S 9,783 287 3 3 4 More N Dakota 8,102 51 4 37 57 More Texas, S 7,880 640 5 2 2 More Ala, M 7,397 71 6 81 77 More Ala, S 7,244 51 7 59 52 More Ga, S 6,353 84 8 50 56 More S Dakota 6,313 45 9 28 28 More La, M 5,035 35 10 80 84 More Table 3. Top 10 Districts (per ten million people)
The District of New Mexico — with 24367 convictions as compared with 2496.4 convictions per ten million population in the United States — was the most active during April 2019. The District of New Mexico was ranked 4 a year ago, while it was ranked 5 for most frequent use five years ago.
The Western District of Texas (San Antonio) ranked 2nd. The Western District of Texas (San Antonio) was ranked 1 a year ago, while it was ranked 1 for most frequent use five years ago.
Southern District of California (San Diego) is now ranking 3rd. The Southern District of California (San Diego) was ranked 3 a year ago, while it was ranked 4 for most frequent use five years ago.
Recent entrants to the top 10 list were South Dakota , now ranked 9th , and North Dakota at 4th In the same order, these districts ranked 28th and 37th one year ago and 28th and 57th five years ago.
The federal judicial district which showed the greatest growth in the rate of convictions compared to one year ago — 47.4 percent — was Middle District of Alabama (Montgomery). Compared to five years ago, the district with the largest growth — 19.6 percent — was Western District of Texas (San Antonio).
In the last year, the judicial District Court recording the largest drop in the rate of convictions — 14.9 percent — was North Dakota . But over the past five years, South Dakota showed the largest drop — 29.8 percent.
Top Ranked District Judges
At any one time, there are about 680 federal District Court judges working in the United States. The judges recorded with the largest number of new crime cases resulting in convictions of this type during April 2019 are shown in Table 4.
Judge Count Rank 1yr ago 5yrs ago Marten, John Thomas N Mexico 155 1 768 140 More Counts, Walter David, III Texas, W 130 2 48 - More Garcia, Orlando Luis Texas, W 128 3 20 64 More Zainey, Jay C. Texas, W 117 4 13 - More Gonzales, Kenneth John N Mexico 114 5 2 2 More Montalvo, Frank Texas, W 89 6 9 14 More Cardone, Kathleen Texas, W 84 7 5 10 More Jack, Janis Graham Texas, S 83 8 51 60 More Guaderrama, David C. Texas, W 80 9 11 11 More Martinez, Philip Ray Texas, W 78 10 8 15 More Table 4. Top Ten Judges
All 10 of the "top ten" judges were in districts which were in the top ten with the largest number of convictions per capit.
Judge John Thomas Marten in the District of New Mexico ranked 1st with 155 convicted in convictions.
Judge Walter David Counts, III in the Western District of Texas (San Antonio) ranked 2nd with 130 convicted in convictions.
Judge Orlando Luis Garcia in the Western District of Texas (San Antonio) ranked 3rd with 128 convicted in convictions.
Report Generated: May 31, 2019