Prosecutions for September 2019
Referring Agency: Federal Bureau of Investigation
The latest available data from the Justice Department show that during September 2019 the government reported 1335 new prosecutions for these matters. Those cases were referred by the Federal Bureau of Investigation. According to the case-by-case information analyzed by the Transactional Records Access Clearinghouse (TRAC), this number is up 13.1 percent over the previous month.
The comparisons of the number of defendants charged are based on case-by-case information obtained by TRAC under the Freedom of Information Act from the Executive Office for United States Attorneys (see Table 1).
When monthly 2019 prosecutions of this type are compared with those of the same period in the previous year, the number of filings was up (2.6%). Prosecutions over the past year are still much higher than they were five years ago. Overall, the data show that prosecutions of this type are up 12.7 percent from levels reported in 2014.
The growth in these cases is partly related to increases in the matters filed in U.S. Magistrate Courts. If magistrate cases are excluded and only Federal District Court cases are counted, the overall increase in prosecutions is 6 percent instead of 12.7 percent. The evidence suggests that part of the difference may be the result of improvements in the recording of the magistrate cases by the Justice Department.
Figure 1. Monthly Trends in Prosecutions
The increase from the levels five years ago in prosecutions for these matters is shown more clearly in Figure 1. The vertical bars in Figure 1 represent the number of prosecutions of this type recorded on a month-to-month basis. Where a prosecution was initially filed in U.S. Magistrate Court and then transferred to the U.S. District Court, the magistrate filing date was used since this provides an earlier indicator of actual trends. The superimposed line on the bars plots the six-month moving average so that natural fluctuations are smoothed out. The one and five-year rates of change in Table 1 and in the sections that follow are all based upon this six-month moving average. To view trends year-by-year rather than month-by-month, see TRAC's annual report series for a broader picture.
Cases were classified by prosecutors into more specific types.
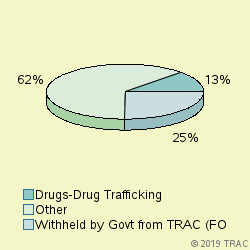
The largest number of prosecutions of these matters in September 2019 was for "Withheld by Govt from TRAC (FOIA challen", accounting for 25.2 percent of prosecutions. Prosecutions were also filed for "Drugs-Drug Trafficking" (12.6%), "Weapons-Operation Triggerlock Major" (10.8%), "Drugs-Organized Crime Task Force" (9.8%), "Project Safe Childhood" (7.2%), "Violence-Other" (5.3%), "Fraud-Health Care" (4.3%), "Bank Robbery" (3.2%), "Violence-Indian Country" (3.1%), "Other Criminal Prosecutions" (2.8%), "Fraud-Computer" (2.2%), "Fraud-Other" (2%). See Figure 2.
Prosecutions in U.S. Magistrate Courts
Top Ranked Lead Charges
In September 2019, 254 defendants in cases for these matters were filed in U.S. Magistrate Courts. These courts handle less serious misdemeanor cases, including what are called "petty offenses." In addition, complaints are sometimes filed in the magistrate courts before an indictment or information is entered. In these cases, the matter starts in the magistrate courts and later moves to the district court where subsequent proceedings take place.
In the magistrate courts in September the most frequently cited lead charge was Title U.S.C Section involving "Other US Code Section". This was the lead charge for 9.8 percent of all magistrate filings in September.
Other frequently prosecuted lead charges include: "21 USC 841 - Drug Abuse Prevention & Control-Prohibited acts A" (8.3%), "18 USC 922 - Firearms; Unlawful acts" (7.9%), "18 USC 2113 - Bank robbery and incidental crimes" (5.9%), "18 USC 1951 - Hobbs Act" (5.1%), "21 USC 846 - Attempt and conspiracy" (5.1%).
Prosecutions in U.S. District Courts
In September 2019, 1081 defendants in new cases for these matters were charged in the U.S. District Courts. In addition during September there were an additional 156 defendants whose cases moved from the magistrate courts to the U.S. district courts after an indictment or information was filed. The sections which follow cover both sets of cases and therefore cover all matters filed in district court during September.
Top Ranked Lead Charges
Table 2 shows the top lead charges recorded in the prosecutions of matters filed in U.S. District Court during September 2019 referred by the Federal Bureau of Investigation.
Lead Charge Count Rank 1yr ago 5yrs ago 21 USC 841 - Drug Abuse Prevention & Control-Prohibited acts A 156 1 1 2 More 21 USC 846 - Attempt and conspiracy 130 2 2 1 More 18 USC 922 - Firearms; Unlawful acts 106 3 3 6 More 18 USC 2113 - Bank robbery and incidental crimes 47 4 4 3 More 18 USC 1951 - Hobbs Act 44 5 5 7 More 18 USC 1343 - Fraud by wire, radio, or television 38 6 7 4 More 18 USC 2252 - Material involving sexual exploitation of minors 35 7 6 5 More 18 USC 371 - Conspiracy to commit offense or to defraud US 22 8 11 10 More 18 USC 113 - Assaults within maritime and territorial jurisdictions 18 9 8 17 More 18 USC 1344 - Bank Fraud 18 9 15 11 More 18 USC 2252A - Activity relating material constituting/containing chil 18 9 9 18 More Table 2. Top Charges Filed
"Drug Abuse Prevention & Control-Prohibited acts A" (Title 21 U.S.C Section 841) was the most frequent recorded lead charge. "Drug Abuse Prevention & Control-Prohibited acts A" (Title 21 U.S.C Section 841) was ranked 1 a year ago, while it was ranked 2 five years ago.
Ranked 2nd in frequency was the lead charge "Attempt and conspiracy" under Title 21 U.S.C Section 846. "Attempt and conspiracy" under Title 21 U.S.C Section 846 was ranked 2 a year ago, while it was ranked 1 five years ago.
Ranked 3rd was "Firearms; Unlawful acts" under Title 18 U.S.C Section 922. "Firearms; Unlawful acts" under Title 18 U.S.C Section 922 was ranked 3 a year ago, while it was ranked 6 five years ago.
Among these top ten lead charges, the one showing the greatest increase in prosecutions — up 42 percent — compared to one year ago was Title 18 U.S.C Section 1344 that involves " Bank Fraud ". Compared to five years ago, the largest increase — 205 percent — was registered for prosecutions under " Firearms; Unlawful acts " (Title 18 U.S.C Section 922 ).
Again among the top ten lead charges, the one showing the sharpest decline in prosecutions compared to one year ago — down 27.2 percent — was " Conspiracy to commit offense or to defraud US " (Title 18 U.S.C Section 371 ). This was the same statute that had the largest decrease — 43.2 % — when compared with five years ago.
Top Ranked Judicial Districts
In September 2019 the Justice Department's case-by-case records show that the government brought 455.7 prosecutions for every ten million people in the United States.
Understandably, there is great variation in the per capita number of prosecutions that are filed in each of the nation's ninety-four federal judicial districts.
The districts registering the largest number of prosecutions per capita for these matters last month are shown in Table 3. Districts must have at least 5 prosecutions to receive a ranking.
Judicial District Percapita Count Rank 1yr ago 5yrs ago W Virg, S 5,395 40 1 79 80 More Ala, S 1,989 14 2 40 60 More D. C. 1,902 11 3 12 55 More Ark, E 1,681 23 4 35 37 More Mo, E 1,680 41 5 27 53 More Wyoming 1,657 8 6 87 82 More Montana 1,485 13 7 21 27 More Ga, S 1,361 18 8 73 24 More N Mexico 1,322 23 9 26 25 More Tenn, E 1,145 25 10 56 45 More Table 3. Top 10 Districts (per ten million people)
The Southern District of West Virginia (Charleston) — with 5395 prosecutions as compared with 455.7 prosecutions per ten million population in the United States — was the most active during September 2019.
The Southern District of Alabama (Mobile) ranked 2nd.
District of Washington, D.C. (Washington) is now ranking 3rd.
Recent entrants to the top 10 list were Washington, D.C. (Washington), now ranked 3rd , and Montana at 7th In the same order, these districts ranked 12th and 21st one year ago and 55th and 27th five years ago.
The federal judicial district which showed the greatest growth in the rate of prosecutions compared to one year ago — 183.3 percent — was Southern District of West Virginia (Charleston). Compared to five years ago, the district with the largest growth — 261.9 percent — was Eastern District of Missouri (St. Louis).
In the last year, the judicial District Court recording the largest drop in the rate of prosecutions — 43.3 percent — was Washington, D.C. (Washington). But over the past five years, Southern District of Georgia (Savannah) showed the largest drop — 39.1 percent.
Top Ranked District Judges
At any one time, there are about 680 federal District Court judges working in the United States. The judges recorded with the largest number of new crime cases of this type during September 2019 are shown in Table 4.
Judge Count Rank 1yr ago 5yrs ago Yeakel, Earl Leroy, III Texas, W 21 1 645 355 More Chambers, Robert Charles W Virg, S 21 1 280 - More Glasser, Israel Leo N. Y., E 18 3 280 47 More Marshall, Denzil Price, Jr. Ark, E 14 4 175 115 More Battaglia, Anthony Joseph Cal, S 13 5 - 414 More Sippel, Rodney W. Mo, E 13 5 243 414 More Berger, Irene Cornelia W Virg, S 13 5 - - More Peterson, James Donald Wisc, W 13 5 243 583 More Williams, Kathleen Mary Fla, S 10 9 10 34 More Woodlock, Douglas Preston Mass 10 9 175 - More Griesbach, William C. Wisc, E 10 9 114 224 More Table 4. Top Ten Judges
A total of 4 out of the "top ten" judges were in districts which were in the top ten with the largest number of filings per capita, while the remaining 7 judges were from other districts. (Because of ties, there were a total of 11 judges in the "top ten" rankings.)
Judges Earl Leroy Yeakel, III in the Western District of Texas (San Antonio) and Robert Charles Chambers in the Southern District of West Virginia (Charleston) ranked 1st with 21 defendants in cases.
Judge Israel Leo Glasser in the Eastern District of New York (Brooklyn) ranked 3rd with 18 defendants in cases.
Report Generated: October 25, 2019