Prosecutions for June 2022
Referring Agency: Federal Bureau of Investigation
The latest available data from the Justice Department show that during June 2022 the government reported 1111 new prosecutions for these matters. Those cases were referred by the Federal Bureau of Investigation. According to the case-by-case information analyzed by the Transactional Records Access Clearinghouse (TRAC), this number is down 4.4 percent over the previous month.
The comparisons of the number of defendants charged are based on case-by-case information obtained by TRAC under the Freedom of Information Act from the Executive Office for United States Attorneys (see Table 1).
When monthly 2022 prosecutions of this type are compared with those of the same period in the previous year, the number of filings was down (-9%). Prosecutions over the past year are still much lower than they were five years ago. Overall, the data show that prosecutions of this type are down 5.7 percent from levels reported in 2017.
Figure 1. Monthly Trends in Prosecutions
The leveling out from the levels five years ago in prosecutions for these matters is shown more clearly in Figure 1. The vertical bars in Figure 1 represent the number of prosecutions of this type recorded on a month-to-month basis. Where a prosecution was initially filed in U.S. Magistrate Court and then transferred to the U.S. District Court, the magistrate filing date was used since this provides an earlier indicator of actual trends. The superimposed line on the bars plots the six-month moving average so that natural fluctuations are smoothed out. The one and five-year rates of change in Table 1 and in the sections that follow are all based upon this six-month moving average. To view trends year-by-year rather than month-by-month, see TRAC's annual report series for a broader picture.
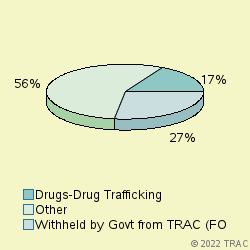
Cases were classified by prosecutors into more specific types.
The largest number of prosecutions of these matters in June 2022 was for "Withheld by Govt from TRAC (FOIA challen", accounting for 27.2 percent of prosecutions. Prosecutions were also filed for "Drugs-Drug Trafficking" (17.2%), "Weapons-Operation Triggerlock Major" (8.5%), "Project Safe Childhood" (7.7%), "Drugs-Organized Crime Task Force" (5.3%), "Violence-Other" (5.2%), "Violence-Indian Country" (4.4%), "Other Criminal Prosecutions" (3.7%), "Bank Robbery" (3.6%), "Terrorism-Domestic" (3.1%), "Fraud-Other" (2.1%). See Figure 2.
Prosecutions in U.S. Magistrate Courts
Top Ranked Lead Charges
In June 2022, 191 defendants in cases for these matters were filed in U.S. Magistrate Courts. These courts handle less serious misdemeanor cases, including what are called "petty offenses." In addition, complaints are sometimes filed in the magistrate courts before an indictment or information is entered. In these cases, the matter starts in the magistrate courts and later moves to the district court where subsequent proceedings take place.
In the magistrate courts in June the most frequently cited lead charge was Title 18 U.S.C Section 922 involving "Firearms; Unlawful acts". This was the lead charge for 7.3 percent of all magistrate filings in June.
Other frequently prosecuted lead charges include: "21 USC 841 - Drug Abuse Prevention & Control-Prohibited acts A" (7.3%), "18 USC 2113 - Bank robbery and incidental crimes" (6.8%).
Prosecutions in U.S. District Courts
In June 2022, 920 defendants in new cases for these matters were charged in the U.S. District Courts. In addition during June there were an additional 172 defendants whose cases moved from the magistrate courts to the U.S. district courts after an indictment or information was filed. The sections which follow cover both sets of cases and therefore cover all matters filed in district court during June.
Top Ranked Lead Charges
Table 2 shows the top lead charges recorded in the prosecutions of matters filed in U.S. District Court during June 2022 referred by the Federal Bureau of Investigation.
Lead Charge Count Rank 1yr ago 5yrs ago 21 USC 841 - Drug Abuse Prevention & Control-Prohibited acts A 143 1 1 2 More 21 USC 846 - Attempt and conspiracy 86 2 3 1 More 18 USC 922 - Firearms; Unlawful acts 78 3 2 4 More 18 USC 2113 - Bank robbery and incidental crimes 41 4 7 3 More 18 USC 1951 - Hobbs Act 35 5 8 7 More 18 USC 1343 - Fraud by wire, radio, or television 33 6 4 6 More 18 USC 2252 - Material involving sexual exploitation of minors 26 7 5 5 More 18 USC 113 - Assaults within maritime and territorial jurisdictions 20 9 9 11 More 18 USC 875 - Interstate Communications 18 10 20 37 More Table 2. Top Charges Filed
"Drug Abuse Prevention & Control-Prohibited acts A" (Title 21 U.S.C Section 841) was the most frequent recorded lead charge. "Drug Abuse Prevention & Control-Prohibited acts A" (Title 21 U.S.C Section 841) was ranked 1 a year ago, while it was ranked 2 five years ago.
Ranked 2nd in frequency was the lead charge "Attempt and conspiracy" under Title 21 U.S.C Section 846. "Attempt and conspiracy" under Title 21 U.S.C Section 846 was ranked 3 a year ago, while it was ranked 1 five years ago.
Ranked 3rd was "Firearms; Unlawful acts" under Title 18 U.S.C Section 922. "Firearms; Unlawful acts" under Title 18 U.S.C Section 922 was ranked 2 a year ago, while it was ranked 4 five years ago.
Among these top ten lead charges, the one showing the greatest increase in prosecutions — up 44.8 percent — compared to one year ago was Title 21 U.S.C Section 846 that involves " Attempt and conspiracy ". Compared to five years ago, the largest increase — 131.8 percent — was registered for prosecutions under " Interstate Communications " (Title 18 U.S.C Section 875 ).
Again among the top ten lead charges, the one showing the sharpest decline in prosecutions compared to one year ago — down 36.3 percent — was " Assaults within maritime and territorial jurisdictions " (Title 18 U.S.C Section 113 ). Compared to five years ago, the most significant decline in prosecutions — 54.6 percent — was for filings where the lead charge was " Bank robbery and incidental crimes " (Title 18 U.S.C Section 2113 ).
Top Ranked Judicial Districts
In June 2022 the Justice Department's case-by-case records show that the government brought 399.2 prosecutions for every ten million people in the United States.
Understandably, there is great variation in the per capita number of prosecutions that are filed in each of the nation's ninety-four federal judicial districts.
The districts registering the largest number of prosecutions per capita for these matters last month are shown in Table 3. Districts must have at least 5 prosecutions to receive a ranking.
Judicial District Percapita Count Rank 1yr ago 5yrs ago D. C. 6,121 36 1 1 47 More N Mexico 2,117 37 2 10 34 More Okla, N 2,019 18 3 5 88 More Ga, M 1,892 32 4 60 54 More Okla, E 1,760 11 5 3 93 More S Dakota 1,654 12 6 42 42 More Mo, W 1,532 41 7 35 43 More Okla, W 1,516 27 8 26 38 More Montana 1,347 12 9 34 33 More Penn, M 1,089 29 10 15 34 More Table 3. Top 10 Districts (per ten million people)
The District of Washington, D.C. (Washington) — with 6121 prosecutions as compared with 399.2 prosecutions per ten million population in the United States — was the most active during June 2022. The District of Washington, D.C. (Washington) was ranked 1 a year ago.
The District of New Mexico ranked 2nd. The District of New Mexico was ranked 10 a year ago.
Northern District of Oklahoma (Tulsa) is now ranking 3rd. The Northern District of Oklahoma (Tulsa) was ranked 5 a year ago.
Recent entrants to the top 10 list were Middle District of Pennsylvania (Scranton), now ranked 10th , and Western District of Oklahoma (Oklahoma City) at 8th In the same order, these districts ranked 15th and 26th one year ago and 34th and 38th five years ago.
The federal judicial district which showed the greatest growth in the rate of prosecutions compared to one year ago — 100 percent — was Middle District of Georgia (Macon). Compared to five years ago, the district with the largest growth — 1016.7 percent — was Eastern District of Oklahoma (Muskogee).
In the last year, the judicial District Court recording the largest drop in the rate of prosecutions — 72.2 percent — was Eastern District of Oklahoma (Muskogee). But over the past five years, Southern District of West Virginia (Charleston) showed the largest drop — 20 percent.
Top Ranked District Judges
At any one time, there are about 680 federal District Court judges working in the United States. The judges recorded with the largest number of new crime cases of this type during June 2022 are shown in Table 4.
Judge Count Rank 1yr ago 5yrs ago Wimes, Brian Curtis Mo, W 27 1 292 564 More Abrams, Leslie Joyce Ga, M 23 2 358 469 More Meyer, Jeffrey Alker Conn 16 3 123 396 More Riggs, Kea W. N Mexico 12 4 9 - More Brann, Matthew William Penn, M 12 4 77 66 More Broderick, Vernon Speede N. Y., S 10 6 508 469 More Morris, Brian Matthew Montana 9 7 36 66 More Mueller, Kimberly Jo Cal, E 8 8 429 469 More Ray, William McCrary, II Ga, N 8 8 429 - More White, Ronald A. Okla, E 8 8 3 335 More Frizzell, Gregory Kent Okla, N 8 8 1 667 More Table 4. Top Ten Judges
A total of 7 out of the "top ten" judges were in districts which were in the top ten with the largest number of filings per capita, while the remaining 4 judges were from other districts. (Because of ties, there were a total of 11 judges in the "top ten" rankings.)
Judge Brian Curtis Wimes in the Western District of Missouri (Kansas City) ranked 1st with 27 defendants in cases.
Judge Leslie Joyce Abrams in the Middle District of Georgia (Macon) ranked 2nd with 23 defendants in cases.
Judge Jeffrey Alker Meyer in the District of Connecticut ranked 3rd with 16 defendants in cases.
Report Generated: August 3, 2022