Convictions for February 2024
Referring Agency: Federal Bureau of Investigation
The latest available data from the Justice Department show that during February 2024 the government reported 1049 new convictions for these matters. Those cases were referred by the Federal Bureau of Investigation. According to the case-by-case information analyzed by the Transactional Records Access Clearinghouse (TRAC), this number is up 9.2 percent over the previous month.
The comparisons of the number of defendants convicted are based on case-by-case information obtained by TRAC under the Freedom of Information Act from the Executive Office for United States Attorneys (see Table 1).
When monthly 2024 convictions of this type are compared with those of the same period in the previous year, the number of convictions was up (10.2%). Convictions over the past year are still much higher than they were five years ago. Overall, the data show that convictions of this type are up 25.4 percent from levels reported in 2019.
Figure 1. Monthly Trends in Convictions
The increase from the levels five years ago in convictions for these matters is shown more clearly in Figure 1. The vertical bars in Figure 1 represent the number of convictions of this type recorded on a month-to-month basis. Where a prosecution was initially filed in U.S. Magistrate Court and then transferred to the U.S. District Court, the magistrate filing date was used since this provides an earlier indicator of actual trends. The superimposed line on the bars plots the six-month moving average so that natural fluctuations are smoothed out. The one and five-year rates of change in Table 1 and in the sections that follow are all based upon this six-month moving average. To view trends year-by-year rather than month-by-month, see TRAC's annual report series for a broader picture.
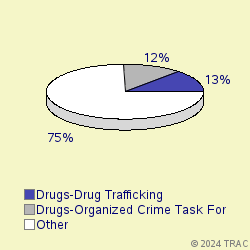
Cases were classified by prosecutors into more specific types.
The largest number of convictions of these matters in February 2024 was for "Drugs-Drug Trafficking", accounting for 13.1 percent of convictions. Convictions were also filed for "Drugs-Organized Crime Task Force" (12.2%), "Project Safe Childhood" (12.2%), "Weapons-Operation Triggerlock Major" (12.2%), "Violence-Indian Country" (7.7%), "Withheld by Govt from TRAC (FOIA challen" (7.3%), "Violence-Other" (5.6%), "Terrorism-Domestic" (4%), "Fraud-Other" (3.8%), "Bank Robbery" (3%), "Other Criminal Prosecutions" (2.5%). See Figure 2.
Convictions in U.S. Magistrate Courts
Top Ranked Lead Charges
In February 2024, no defendants in cases for these matters were convicted in U.S. Magistrate Courts. These courts handle less serious misdemeanor cases, including what are called "petty offenses." In addition, complaints are sometimes filed in the magistrate courts before an indictment or information is entered. In these cases, the matter starts in the magistrate courts and later moves to the district court where subsequent proceedings take place.
Convictions in U.S. District Courts
In February 2024, 1048 defendants in new cases for these matters were charged in the U.S. District Courts. In addition during February there were an additional 0 defendants whose cases moved from the magistrate courts to the U.S. district courts after an indictment or information was filed. The sections which follow cover both sets of cases and therefore cover all matters filed in district court during February.
Top Ranked Lead Charges
Table 2 shows the top lead charges recorded in the convictions of matters filed in U.S. District Court during February 2024 referred by the Federal Bureau of Investigation.
Lead Charge Count Rank 1yr ago 5yrs ago 21 USC 841 - Drug Abuse Prevention & Control-Prohibited acts A 141 1 1 2 More 18 USC 922 - Firearms; Unlawful acts 99 2 2 3 More 21 USC 846 - Attempt and conspiracy 86 3 3 1 More 18 USC 1343 - Fraud by wire, radio, or television 45 4 4 5 More 18 USC 1951 - Hobbs Act 44 5 5 7 More 18 USC 2252 - Material involving sexual exploitation of minors 39 7 6 6 More 18 USC 2113 - Bank robbery and incidental crimes 34 8 7 4 More 18 USC 113 - Assaults within maritime and territorial jurisdictions 28 9 9 9 More 18 USC 1752 - Temporary residence and office of President, etc. 27 10 19 - More Table 2. Top Charges for Convictions
"Drug Abuse Prevention & Control-Prohibited acts A" (Title 21 U.S.C Section 841) was the most frequent recorded lead charge. "Drug Abuse Prevention & Control-Prohibited acts A" (Title 21 U.S.C Section 841) was ranked 1 a year ago, while it was ranked 2 five years ago.
Ranked 2nd in frequency was the lead charge "Firearms; Unlawful acts" under Title 18 U.S.C Section 922. "Firearms; Unlawful acts" under Title 18 U.S.C Section 922 was ranked 2 a year ago, while it was ranked 3 five years ago.
Ranked 3rd was "Attempt and conspiracy" under Title 21 U.S.C Section 846. "Attempt and conspiracy" under Title 21 U.S.C Section 846 was ranked 3 a year ago, while it was ranked 1 five years ago.
Among these top ten lead charges, the one showing the greatest increase in convictions — up 129.3 percent — compared to one year ago was Title 18 U.S.C Section 1752 that involves " Temporary residence and office of President, etc. ". Compared to five years ago, the largest increase — 87.2 percent — was registered for convictions under "Other US Code Section " (Title U.S.C Section ).
Again among the top ten lead charges, the one showing the sharpest decline in convictions compared to one year ago — down 12 percent — was " Firearms; Unlawful acts " (Title 18 U.S.C Section 922 ). Compared to five years ago, the most significant decline in convictions — 32.8 percent — was for convictions where the lead charge was " Bank robbery and incidental crimes " (Title 18 U.S.C Section 2113 ).
Top Ranked Judicial Districts
In February 2024 the Justice Department's case-by-case records show that the government obtained 377.3 convictions for every ten million people in the United States.
Understandably, there is great variation in the per capita number of convictions in each of the nation's ninety-four federal judicial districts.
The districts registering the largest number of convictions per capita for these matters last month are shown in Table 3. Districts must have at least 5 convictions to receive a ranking.
Judicial District Percapita Count Rank 1yr ago 5yrs ago D. C. 10,003 56 1 11 53 More Montana 4,382 41 2 24 19 More Alaska 3,758 22 3 46 47 More Okla, E 2,922 18 4 16 88 More Okla, N 2,294 21 5 27 77 More N Mexico 1,476 26 6 8 27 More Delaware 1,296 11 7 89 90 More Tenn, W 1,080 14 8 15 26 More Tenn, E 1,006 23 9 30 33 More N. Y., S 949 41 10 21 12 More Table 3. Top 10 Districts (per ten million people)
The District of Washington, D.C. (Washington) — with 10003 convictions as compared with 377.3 convictions per ten million population in the United States — was the most active during February 2024.
The District of Montana ranked 2nd.
District of Alaska is now ranking 3rd.
Recent entrants to the top 10 list were Washington, D.C. (Washington), now ranked 1st , and Western District of Tennessee (Memphis) at 8th In the same order, these districts ranked 11th and 15th one year ago and 53rd and 26th five years ago.
The federal judicial district which showed the greatest growth in the rate of convictions compared to one year ago — 175 percent — was Washington, D.C. (Washington). Compared to five years ago, the district with the largest growth — 814.3 percent — was Eastern District of Oklahoma (Muskogee).
In the last year, the judicial District Court recording the largest drop in the rate of convictions — 61.5 percent — was Western District of Tennessee (Memphis). This was the same district that had the largest increase — 50.7 percent — when compared with five years ago.
Top Ranked District Judges
At any one time, there are about 680 federal District Court judges working in the United States. The judges recorded with the largest number of new crime cases resulting in convictions of this type during February 2024 are shown in Table 4.
Judge Count Rank 1yr ago 5yrs ago Morris, Brian Matthew Montana 21 1 25 8 More Byron, Paul Gregory Fla, M 18 2 127 222 More Dalton, Roy Bale, Jr. Fla, M 14 3 438 96 More Corker, Clifton Leland Tenn, E 12 4 523 - More Stadtmueller, Joseph Peter Wisc, E 12 4 127 503 More Watters, Susan Pamela Montana 11 6 10 13 More Caproni, Valerie Elaine N. Y., S 11 6 302 400 More Moss, Randolph Daniel D. C. 10 8 244 400 More Burgess, Timothy Mark Alaska 9 9 12 13 More Rayes, Douglas Leroy Arizona 9 9 32 3 More Table 4. Top Ten Judges
A total of 6 out of the "top ten" judges were in districts which were in the top ten with the largest number of convictions per capita, while the remaining 4 judges were from other districts.
Judge Brian Matthew Morris in the District of Montana ranked 1st with 21 convicted in convictions.
Judge Paul Gregory Byron in the Middle District of Florida (Tampa) ranked 2nd with 18 convicted in convictions.
Judge Roy Bale Dalton, Jr. in the Middle District of Florida (Tampa) ranked 3rd with 14 convicted in convictions.
Report Generated: April 3, 2024