Prosecutions for February 2024
Referring Agency: Federal Bureau of Investigation
The latest available data from the Justice Department show that during February 2024 the government reported 969 new prosecutions for these matters. Those cases were referred by the Federal Bureau of Investigation. According to the case-by-case information analyzed by the Transactional Records Access Clearinghouse (TRAC), this number is up 2.1 percent over the previous month.
The comparisons of the number of defendants charged are based on case-by-case information obtained by TRAC under the Freedom of Information Act from the Executive Office for United States Attorneys (see Table 1).
When monthly 2024 prosecutions of this type are compared with those of the same period in the previous year, the number of filings was down (-4.2%). Prosecutions over the past year are still much lower than they were five years ago. Overall, the data show that prosecutions of this type are down 12.6 percent from levels reported in 2019.
Figure 1. Monthly Trends in Prosecutions
The decrease from the levels five years ago in prosecutions for these matters is shown more clearly in Figure 1. The vertical bars in Figure 1 represent the number of prosecutions of this type recorded on a month-to-month basis. Where a prosecution was initially filed in U.S. Magistrate Court and then transferred to the U.S. District Court, the magistrate filing date was used since this provides an earlier indicator of actual trends. The superimposed line on the bars plots the six-month moving average so that natural fluctuations are smoothed out. The one and five-year rates of change in Table 1 and in the sections that follow are all based upon this six-month moving average. To view trends year-by-year rather than month-by-month, see TRAC's annual report series for a broader picture.
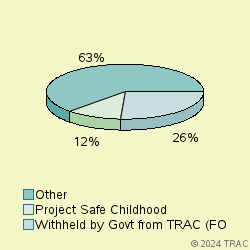
Cases were classified by prosecutors into more specific types.
The largest number of prosecutions of these matters in February 2024 was for "Withheld by Govt from TRAC (FOIA challen", accounting for 25.9 percent of prosecutions. Prosecutions were also filed for "Project Safe Childhood" (11.6%), "Drugs-Drug Trafficking" (10.7%), "Weapons-Operation Triggerlock Major" (9.2%), "Violence-Other" (7.1%), "Drugs-Organized Crime Task Force" (4.2%), "Terrorism-Domestic" (4%), "Violence-Indian Country" (3.9%), "Other Criminal Prosecutions" (3.3%), "Fraud-Other" (2.2%). See Figure 2.
Prosecutions in U.S. Magistrate Courts
Top Ranked Lead Charges
In February 2024, 175 defendants in cases for these matters were filed in U.S. Magistrate Courts. These courts handle less serious misdemeanor cases, including what are called "petty offenses." In addition, complaints are sometimes filed in the magistrate courts before an indictment or information is entered. In these cases, the matter starts in the magistrate courts and later moves to the district court where subsequent proceedings take place.
In the magistrate courts in February the most frequently cited lead charge was Title 18 U.S.C Section 922 involving "Firearms; Unlawful acts". This was the lead charge for 11.4 percent of all magistrate filings in February.
Other frequently prosecuted lead charges include: "21 USC 841 - Drug Abuse Prevention & Control-Prohibited acts A" (10.3%), "18 USC 2252 - Material involving sexual exploitation of minors" (6.9%).
Prosecutions in U.S. District Courts
In February 2024, 794 defendants in new cases for these matters were charged in the U.S. District Courts. In addition during February there were an additional 141 defendants whose cases moved from the magistrate courts to the U.S. district courts after an indictment or information was filed. The sections which follow cover both sets of cases and therefore cover all matters filed in district court during February.
Top Ranked Lead Charges
Table 2 shows the top lead charges recorded in the prosecutions of matters filed in U.S. District Court during February 2024 referred by the Federal Bureau of Investigation.
Lead Charge Count Rank 1yr ago 5yrs ago 21 USC 841 - Drug Abuse Prevention & Control-Prohibited acts A 110 1 1 1 More 18 USC 922 - Firearms; Unlawful acts 81 2 2 3 More 18 USC 1343 - Fraud by wire, radio, or television 53 3 4 7 More 18 USC 2252 - Material involving sexual exploitation of minors 49 4 5 6 More 18 USC 1951 - Hobbs Act 42 5 8 5 More 18 USC 2113 - Bank robbery and incidental crimes 25 7 6 4 More 18 USC 1752 - Temporary residence and office of President, etc. 24 8 18 - More 21 USC 846 - Attempt and conspiracy 23 9 3 2 More 18 USC 2250 - Fail to register as sex offender after traveling interstate commerce 22 10 16 14 More Table 2. Top Charges Filed
"Drug Abuse Prevention & Control-Prohibited acts A" (Title 21 U.S.C Section 841) was the most frequent recorded lead charge. "Drug Abuse Prevention & Control-Prohibited acts A" (Title 21 U.S.C Section 841) was ranked 1 a year ago, while it was ranked 1 five years ago.
Ranked 2nd in frequency was the lead charge "Firearms; Unlawful acts" under Title 18 U.S.C Section 922. "Firearms; Unlawful acts" under Title 18 U.S.C Section 922 was ranked 2 a year ago, while it was ranked 3 five years ago.
Ranked 3rd was "Fraud by wire, radio, or television" under Title 18 U.S.C Section 1343. "Fraud by wire, radio, or television" under Title 18 U.S.C Section 1343 was ranked 4 a year ago, while it was ranked 7 five years ago.
Among these top ten lead charges, the one showing the greatest increase in prosecutions — up 57.6 percent — compared to one year ago was Title 18 U.S.C Section 1752 that involves " Temporary residence and office of President, etc. ". Compared to five years ago, the largest increase — 35.5 percent — was registered for prosecutions under "Other US Code Section " (Title U.S.C Section ).
Again among the top ten lead charges, the one showing the sharpest decline in prosecutions compared to one year ago — down 30.6 percent — was " Attempt and conspiracy " (Title 21 U.S.C Section 846 ). Compared to five years ago, the most significant decline in prosecutions — 55.6 percent — was for filings where the lead charge was " Bank robbery and incidental crimes " (Title 18 U.S.C Section 2113 ).
Top Ranked Judicial Districts
In February 2024 the Justice Department's case-by-case records show that the government brought 336.6 prosecutions for every ten million people in the United States.
Understandably, there is great variation in the per capita number of prosecutions that are filed in each of the nation's ninety-four federal judicial districts.
The districts registering the largest number of prosecutions per capita for these matters last month are shown in Table 3. Districts must have at least 5 prosecutions to receive a ranking.
Judicial District Percapita Count Rank 1yr ago 5yrs ago D. C. 8,574 48 1 1 26 More New Hamp 1,548 18 2 81 84 More Montana 1,496 14 3 21 35 More S Dakota 1,071 8 4 36 43 More Alaska 1,025 6 5 70 52 More N Mexico 965 17 6 19 17 More Okla, E 812 5 7 59 89 More Ken, E 807 15 8 39 71 More Tenn, E 787 18 9 39 21 More Utah 745 21 10 23 32 More Table 3. Top 10 Districts (per ten million people)
The District of Washington, D.C. (Washington) — with 8574 prosecutions as compared with 336.6 prosecutions per ten million population in the United States — was the most active during February 2024. The District of Washington, D.C. (Washington) was ranked 1 a year ago.
The District of New Hampshire ranked 2nd.
District of Montana is now ranking 3rd.
Recent entrants to the top 10 list were New Mexico , now ranked 6th , and Montana at 3rd In the same order, these districts ranked 19th and 21st one year ago and 17th and 35th five years ago.
The federal judicial district which showed the greatest growth in the rate of prosecutions compared to one year ago — 94.7 percent — was New Hampshire . Compared to five years ago, the district with the largest growth — 375 percent — was Eastern District of Oklahoma (Muskogee).
In the last year, the judicial District Court recording the largest drop in the rate of prosecutions — 29.6 percent — was Montana . But over the past five years, Eastern District of Tennessee (Knoxville) showed the largest drop — 39.2 percent.
Top Ranked District Judges
At any one time, there are about 680 federal District Court judges working in the United States. The judges recorded with the largest number of new crime cases of this type during February 2024 are shown in Table 4.
Judge Count Rank Gaughan, Patricia Anne Ohio, N 10 1 More Nielson, Howard Curtis, Jr. Utah 10 1 More Bunning, David L. Ken, E 8 3 More Watters, Susan Pamela Montana 7 4 More Martinotti, Brian R. N. J. 6 5 More Mosman, Michael W. Oregon 6 5 More Garcia Marmolejo, Marina Texas, S 6 5 More Peterson, James Donald Wisc, W 6 5 More Scoble, Mathew M. Alaska 5 9 More Tuchi, John Joseph Arizona 5 9 More Jackson, Amy Berman D. C. 5 9 More Sands, W[illie] Louis Ga, M 5 9 More Harjani, Sunil R. Ill, N 5 9 More Reeves, Danny C. Ken, E 5 9 More Walker, Lance Edward Maine 5 9 More Simon, Michael Howard Oregon 5 9 More Kacsmaryk, Matthew Joseph Texas, N 5 9 More Rodriguez, Xavier Texas, W 5 9 More Pitman, Robert Texas, W 5 9 More Table 4. Top Ten Judges
A total of 6 out of the "top ten" judges were in districts which were in the top ten with the largest number of filings per capita, while the remaining 13 judges were from other districts. (Because of ties, there were a total of 19 judges in the "top ten" rankings.)
Judges Patricia Anne Gaughan in the Northern District of Ohio (Cleveland) and Howard Curtis Nielson, Jr. in the District of Utah ranked 1st with 10 defendants in cases.
Judge David L. Bunning in the Eastern District of Kentucky (Lexington) ranked 3rd with 8 defendants in cases.
Report Generated: April 3, 2024