Convictions for December 2023
Referring Agency: Federal Bureau of Investigation
The latest available data from the Justice Department show that during December 2023 the government reported 866 new convictions for these matters. Those cases were referred by the Federal Bureau of Investigation. According to the case-by-case information analyzed by the Transactional Records Access Clearinghouse (TRAC), this number is up 4.6 percent over the previous month.
The comparisons of the number of defendants convicted are based on case-by-case information obtained by TRAC under the Freedom of Information Act from the Executive Office for United States Attorneys (see Table 1).
When monthly 2023 convictions of this type are compared with those of the same period in the previous year, the number of convictions was up (26.5%). Convictions over the past year are still much higher than they were five years ago. Overall, the data show that convictions of this type are up 25.7 percent from levels reported in 2018.
Figure 1. Monthly Trends in Convictions
The increase from the levels five years ago in convictions for these matters is shown more clearly in Figure 1. The vertical bars in Figure 1 represent the number of convictions of this type recorded on a month-to-month basis. Where a prosecution was initially filed in U.S. Magistrate Court and then transferred to the U.S. District Court, the magistrate filing date was used since this provides an earlier indicator of actual trends. The superimposed line on the bars plots the six-month moving average so that natural fluctuations are smoothed out. The one and five-year rates of change in Table 1 and in the sections that follow are all based upon this six-month moving average. To view trends year-by-year rather than month-by-month, see TRAC's annual report series for a broader picture.
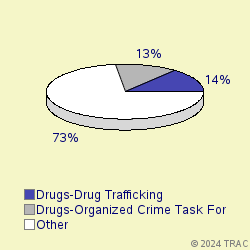
Cases were classified by prosecutors into more specific types.
The largest number of convictions of these matters in December 2023 was for "Drugs-Drug Trafficking", accounting for 14.2 percent of convictions. Convictions were also filed for "Drugs-Organized Crime Task Force" (12.8%), "Weapons-Operation Triggerlock Major" (12.2%), "Project Safe Childhood" (11.9%), "Withheld by Govt from TRAC (FOIA challen" (8.5%), "Violence-Indian Country" (6.6%), "Violence-Other" (5.5%), "Bank Robbery" (4.4%), "Fraud-Other" (3.7%), "Other Criminal Prosecutions" (2.8%). See Figure 2.
Convictions in U.S. Magistrate Courts
Top Ranked Lead Charges
In December 2023, no defendants in cases for these matters were convicted in U.S. Magistrate Courts. These courts handle less serious misdemeanor cases, including what are called "petty offenses." In addition, complaints are sometimes filed in the magistrate courts before an indictment or information is entered. In these cases, the matter starts in the magistrate courts and later moves to the district court where subsequent proceedings take place.
Convictions in U.S. District Courts
In December 2023, 864 defendants in new cases for these matters were charged in the U.S. District Courts. In addition during December there were an additional 0 defendants whose cases moved from the magistrate courts to the U.S. district courts after an indictment or information was filed. The sections which follow cover both sets of cases and therefore cover all matters filed in district court during December.
Top Ranked Lead Charges
Table 2 shows the top lead charges recorded in the convictions of matters filed in U.S. District Court during December 2023 referred by the Federal Bureau of Investigation.
Lead Charge Count Rank 1yr ago 5yrs ago 21 USC 841 - Drug Abuse Prevention & Control-Prohibited acts A 129 1 1 2 More 18 USC 922 - Firearms; Unlawful acts 97 2 2 4 More 21 USC 846 - Attempt and conspiracy 74 3 3 1 More 18 USC 1343 - Fraud by wire, radio, or television 54 4 4 5 More 18 USC 2113 - Bank robbery and incidental crimes 40 5 7 3 More 18 USC 2252 - Material involving sexual exploitation of minors 31 6 5 6 More 18 USC 1951 - Hobbs Act 24 7 6 7 More 18 USC 113 - Assaults within maritime and territorial jurisdictions 21 9 9 10 More 18 USC 2252A - Activity relating material constituting/containing chil 20 10 10 8 More 18 USC 2422 - Transport for sex - Coercion and enticement 20 10 12 21 More Table 2. Top Charges for Convictions
"Drug Abuse Prevention & Control-Prohibited acts A" (Title 21 U.S.C Section 841) was the most frequent recorded lead charge. "Drug Abuse Prevention & Control-Prohibited acts A" (Title 21 U.S.C Section 841) was ranked 1 a year ago, while it was ranked 2 five years ago.
Ranked 2nd in frequency was the lead charge "Firearms; Unlawful acts" under Title 18 U.S.C Section 922. "Firearms; Unlawful acts" under Title 18 U.S.C Section 922 was ranked 2 a year ago, while it was ranked 4 five years ago.
Ranked 3rd was "Attempt and conspiracy" under Title 21 U.S.C Section 846. "Attempt and conspiracy" under Title 21 U.S.C Section 846 was ranked 3 a year ago, while it was ranked 1 five years ago.
Among these top ten lead charges, the one showing the greatest increase in convictions — up 88.5 percent — compared to one year ago was Title 21 U.S.C Section 846 that involves " Attempt and conspiracy ". Compared to five years ago, the largest increase — 89.7 percent — was registered for convictions under "Other US Code Section " (Title U.S.C Section ).
Again among the top ten lead charges, the one showing the sharpest decline in convictions compared to one year ago — down 3.8 percent — was " Firearms; Unlawful acts " (Title 18 U.S.C Section 922 ). Compared to five years ago, the most significant decline in convictions — 39.1 percent — was for convictions where the lead charge was " Bank robbery and incidental crimes " (Title 18 U.S.C Section 2113 ).
Top Ranked Judicial Districts
In December 2023 the Justice Department's case-by-case records show that the government obtained 311.1 convictions for every ten million people in the United States.
Understandably, there is great variation in the per capita number of convictions in each of the nation's ninety-four federal judicial districts.
The districts registering the largest number of convictions per capita for these matters last month are shown in Table 3. Districts must have at least 5 convictions to receive a ranking.
Judicial District Percapita Count Rank 1yr ago 5yrs ago Okla, E 2,273 14 1 23 92 More La, E 1,673 23 2 72 77 More S Dakota 1,473 11 3 46 49 More D. C. 1,429 8 4 11 49 More Alaska 1,196 7 5 65 51 More Minnesota 1,112 53 6 33 65 More Okla, N 1,092 10 7 14 74 More N Dakota 1,078 7 8 68 61 More Montana 962 9 9 35 22 More N Mexico 795 14 10 6 32 More Table 3. Top 10 Districts (per ten million people)
The Eastern District of Oklahoma (Muskogee) — with 2273 convictions as compared with 311.1 convictions per ten million population in the United States — was the most active during December 2023.
The Eastern District of Louisiana (New Orleans) ranked 2nd.
District of South Dakota is now ranking 3rd.
Recent entrants to the top 10 list were Washington, D.C. (Washington), now ranked 4th , and Northern District of Oklahoma (Tulsa) at 7th In the same order, these districts ranked 11th and 14th one year ago and 49th and 74th five years ago.
The federal judicial district which showed the greatest growth in the rate of convictions compared to one year ago — 148.1 percent — was Washington, D.C. (Washington). Compared to five years ago, the district with the largest growth — 2266.7 percent — was Eastern District of Oklahoma (Muskogee).
In the last year, the judicial District Court recording the largest drop in the rate of convictions — 12 percent — was New Mexico . But over the past five years, showed the largest drop — percent.
Top Ranked District Judges
At any one time, there are about 680 federal District Court judges working in the United States. The judges recorded with the largest number of new crime cases resulting in convictions of this type during December 2023 are shown in Table 4.
Judge Count Rank 1yr ago 5yrs ago Delgado-Colon, Aida M. Puer Rico 20 1 49 157 More Bunning, David L. Ken, E 11 2 32 73 More White, Ronald A. Okla, E 11 2 39 439 More Tunheim, John R. Minnesota 10 4 164 286 More Nelson, Susan Richard Minnesota 9 5 512 252 More Byron, Paul Gregory Fla, M 8 6 231 157 More Lopez, Linda Cal, S 7 7 - - More Carreño-Coll, Silvia Luisa Puer Rico 7 7 2 - More Dalton, Roy Bale, Jr. Fla, M 6 9 432 185 More Altonaga, Cecilia M. Fla, S 6 9 231 56 More Lioi, Sara Elizabeth Ohio, N 6 9 189 157 More Table 4. Top Ten Judges
A total of 3 out of the "top ten" judges were in districts which were in the top ten with the largest number of convictions per capita, while the remaining 8 judges were from other districts. (Because of ties, there were a total of 11 judges in the "top ten" rankings.)
Judge Aida M. Delgado-Colon in the District of Puerto Rico ranked 1st with 20 convicted in convictions.
Judges David L. Bunning in the Eastern District of Kentucky (Lexington) and Ronald A. White in the Eastern District of Oklahoma (Muskogee) ranked 2nd with 11 convicted in convictions.
Report Generated: February 7, 2024