Convictions for December 2023
Referring Agency: Drug Enforcement Administration
The latest available data from the Justice Department show that during December 2023 the government reported 749 new convictions for these matters. Those cases were referred by the Drug Enforcement Administration. According to the case-by-case information analyzed by the Transactional Records Access Clearinghouse (TRAC), this number is up 12.8 percent over the previous month.
The comparisons of the number of defendants convicted are based on case-by-case information obtained by TRAC under the Freedom of Information Act from the Executive Office for United States Attorneys (see Table 1).
When monthly 2023 convictions of this type are compared with those of the same period in the previous year, the number of convictions was up (23.5%). Convictions over the past year are still much higher than they were five years ago. Overall, the data show that convictions of this type are up 18.4 percent from levels reported in 2018.
Figure 1. Monthly Trends in Convictions
The increase from the levels five years ago in convictions for these matters is shown more clearly in Figure 1. The vertical bars in Figure 1 represent the number of convictions of this type recorded on a month-to-month basis. Where a prosecution was initially filed in U.S. Magistrate Court and then transferred to the U.S. District Court, the magistrate filing date was used since this provides an earlier indicator of actual trends. The superimposed line on the bars plots the six-month moving average so that natural fluctuations are smoothed out. The one and five-year rates of change in Table 1 and in the sections that follow are all based upon this six-month moving average. To view trends year-by-year rather than month-by-month, see TRAC's annual report series for a broader picture.
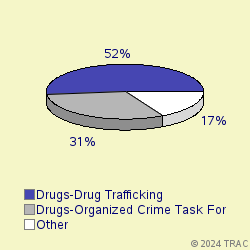
Cases were classified by prosecutors into more specific types.
The largest number of convictions of these matters in December 2023 was for "Drugs-Drug Trafficking", accounting for 51.9 percent of convictions. Convictions were also filed for "Drugs-Organized Crime Task Force" (31%), "Withheld by Govt from TRAC (FOIA challen" (10.8%), "Weapons-Operation Triggerlock Major" (3.9%). See Figure 2.
Convictions in U.S. Magistrate Courts
Top Ranked Lead Charges
In December 2023, no defendants in cases for these matters were convicted in U.S. Magistrate Courts. These courts handle less serious misdemeanor cases, including what are called "petty offenses." In addition, complaints are sometimes filed in the magistrate courts before an indictment or information is entered. In these cases, the matter starts in the magistrate courts and later moves to the district court where subsequent proceedings take place.
Convictions in U.S. District Courts
In December 2023, 749 defendants in new cases for these matters were charged in the U.S. District Courts. In addition during December there were an additional 0 defendants whose cases moved from the magistrate courts to the U.S. district courts after an indictment or information was filed. The sections which follow cover both sets of cases and therefore cover all matters filed in district court during December.
Top Ranked Lead Charges
Table 2 shows the top lead charges recorded in the convictions of matters filed in U.S. District Court during December 2023 referred by the Drug Enforcement Administration.
Lead Charge Count Rank 1yr ago 5yrs ago 21 USC 841 - Drug Abuse Prevention & Control-Prohibited acts A 365 1 1 1 More 21 USC 846 - Attempt and conspiracy 188 2 2 2 More 18 USC 922 - Firearms; Unlawful acts 24 4 3 3 More 46 USC 70506 - Penalties 13 5 10 8 More 18 USC 1956 - Laundering of monetary instruments 9 6 5 7 More 46 USC 70503 - Possession control substance on vessel subject to jurisdiction of US 8 7 6 5 More 21 USC 843 - Drug Abuse Prevention & Control-Prohibited acts C 5 8 7 9 More 18 USC 846 - Explosives - Additional powers of the Secretary 4 9 11 15 More 21 USC 963 - Attempt and conspiracy 4 9 8 6 More Table 2. Top Charges for Convictions
"Drug Abuse Prevention & Control-Prohibited acts A" (Title 21 U.S.C Section 841) was the most frequent recorded lead charge. "Drug Abuse Prevention & Control-Prohibited acts A" (Title 21 U.S.C Section 841) was ranked 1 a year ago, while it was ranked 1 five years ago.
Ranked 2nd in frequency was the lead charge "Attempt and conspiracy" under Title 21 U.S.C Section 846. "Attempt and conspiracy" under Title 21 U.S.C Section 846 was ranked 2 a year ago, while it was ranked 2 five years ago.
Ranked 3rd was "Other US Code Section" under Title U.S.C Section. "Other US Code Section" under Title U.S.C Section was ranked 4 a year ago.
Among these top ten lead charges, the one showing the greatest increase in convictions — up 525 percent — compared to one year ago was Title 46 U.S.C Section 70506 that involves " Penalties ". Compared to five years ago, the largest increase — 1163.6 percent — was registered for convictions under "Other US Code Section " (Title U.S.C Section ).
Again among the top ten lead charges, the one showing the sharpest decline in convictions compared to one year ago — down 21.7 percent — was " Drug Abuse Prevention & Control-Prohibited acts C " (Title 21 U.S.C Section 843 ). Compared to five years ago, the most significant decline in convictions — 41.5 percent — was for convictions where the lead charge was " Attempt and conspiracy " (Title 21 U.S.C Section 963 ).
Top Ranked Judicial Districts
In December 2023 the Justice Department's case-by-case records show that the government obtained 269.7 convictions for every ten million people in the United States.
Understandably, there is great variation in the per capita number of convictions in each of the nation's ninety-four federal judicial districts.
The districts registering the largest number of convictions per capita for these matters last month are shown in Table 3. Districts must have at least 5 convictions to receive a ranking.
Judicial District Percapita Count Rank 1yr ago 5yrs ago Okla, N 1,311 12 1 39 77 More Mo, E 1,277 31 2 4 19 More N Dakota 1,232 8 3 51 65 More La, E 1,091 15 4 55 46 More S Dakota 1,071 8 5 30 68 More Minnesota 1,049 50 6 53 48 More Ken, E 969 18 7 7 7 More Cal, S 764 22 8 8 19 More Utah 710 20 9 6 13 More Ala, M 705 7 10 74 82 More Table 3. Top 10 Districts (per ten million people)
The Northern District of Oklahoma (Tulsa) — with 1311 convictions as compared with 269.7 convictions per ten million population in the United States — was the most active during December 2023.
The Eastern District of Missouri (St. Louis) ranked 2nd. The Eastern District of Missouri (St. Louis) was ranked 4 a year ago.
District of North Dakota is now ranking 3rd.
Recent entrants to the top 10 list were South Dakota , now ranked 5th , and Northern District of Oklahoma (Tulsa) at 1st In the same order, these districts ranked 30th and 39th one year ago and 68th and 77th five years ago.
The federal judicial district which showed the greatest growth in the rate of convictions compared to one year ago — 206.7 percent — was Middle District of Alabama (Montgomery). Compared to five years ago, the district with the largest growth — 276.2 percent — was North Dakota .
Top Ranked District Judges
At any one time, there are about 680 federal District Court judges working in the United States. The judges recorded with the largest number of new crime cases resulting in convictions of this type during December 2023 are shown in Table 4.
Judge Count Rank Frank, Donovan W. Minnesota 13 1 More Bunning, David L. Ken, E 11 2 More Hernandez, Marco Antonio Oregon 11 2 More Davis, Michael James Minnesota 10 4 More Delgado-Colon, Aida M. Puer Rico 10 4 More Besosa, Francisco Augusto Puer Rico 9 6 More Jordan, Sean D. Texas, E 8 7 More Curiel, Gonzalo Paul Cal, S 7 8 More Frizzell, Gregory Kent Okla, N 7 8 More May, Leigh Martin Ga, N 6 10 More Bough, Stephen Rogers Mo, W 6 10 More Mazzant, Amos L. Texas, E 6 10 More Alvarez, Micaela Texas, S 6 10 More Ramos, Nelva Gonzales Texas, S 6 10 More Pitman, Robert Texas, W 6 10 More Dimke, Mary K. Wash, E 6 10 More Table 4. Top Ten Judges
A total of 5 out of the "top ten" judges were in districts which were in the top ten with the largest number of convictions per capita, while the remaining 11 judges were from other districts. (Because of ties, there were a total of 16 judges in the "top ten" rankings.)
Judge Donovan W. Frank in the District of Minnesota ranked 1st with 13 convicted in convictions.
Judges David L. Bunning in the Eastern District of Kentucky (Lexington) and Marco Antonio Hernandez in the District of Oregon ranked 2nd with 11 convicted in convictions.
Report Generated: February 7, 2024