Prosecutions for December 2023
Referring Agency: Drug Enforcement Administration
The latest available data from the Justice Department show that during December 2023 the government reported 629 new prosecutions for these matters. Those cases were referred by the Drug Enforcement Administration. According to the case-by-case information analyzed by the Transactional Records Access Clearinghouse (TRAC), this number is down 8.8 percent over the previous month.
The comparisons of the number of defendants charged are based on case-by-case information obtained by TRAC under the Freedom of Information Act from the Executive Office for United States Attorneys (see Table 1).
When monthly 2023 prosecutions of this type are compared with those of the same period in the previous year, the number of filings was down (-10.9%). Prosecutions over the past year are still much lower than they were five years ago. Overall, the data show that prosecutions of this type are down 28.8 percent from levels reported in 2018.
Figure 1. Monthly Trends in Prosecutions
The decrease from the levels five years ago in prosecutions for these matters is shown more clearly in Figure 1. The vertical bars in Figure 1 represent the number of prosecutions of this type recorded on a month-to-month basis. Where a prosecution was initially filed in U.S. Magistrate Court and then transferred to the U.S. District Court, the magistrate filing date was used since this provides an earlier indicator of actual trends. The superimposed line on the bars plots the six-month moving average so that natural fluctuations are smoothed out. The one and five-year rates of change in Table 1 and in the sections that follow are all based upon this six-month moving average. To view trends year-by-year rather than month-by-month, see TRAC's annual report series for a broader picture.
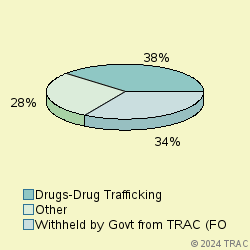
Cases were classified by prosecutors into more specific types.
The largest number of prosecutions of these matters in December 2023 was for "Drugs-Drug Trafficking", accounting for 38.3 percent of prosecutions. Prosecutions were also filed for "Withheld by Govt from TRAC (FOIA challen" (33.5%), "Drugs-Organized Crime Task Force" (23.5%), "Other Criminal Prosecutions" (2.1%). See Figure 2.
Prosecutions in U.S. Magistrate Courts
Top Ranked Lead Charges
In December 2023, 114 defendants in cases for these matters were filed in U.S. Magistrate Courts. These courts handle less serious misdemeanor cases, including what are called "petty offenses." In addition, complaints are sometimes filed in the magistrate courts before an indictment or information is entered. In these cases, the matter starts in the magistrate courts and later moves to the district court where subsequent proceedings take place.
In the magistrate courts in December the most frequently cited lead charge was Title 21 U.S.C Section 841 involving "Drug Abuse Prevention & Control-Prohibited acts A". This was the lead charge for 59.6 percent of all magistrate filings in December.
Other frequently prosecuted lead charges include: "21 USC 846 - Attempt and conspiracy" (11.4%), "18 USC 3048 - Commitment to another district; removal--Rule 40" (9.6%).
Prosecutions in U.S. District Courts
In December 2023, 515 defendants in new cases for these matters were charged in the U.S. District Courts. In addition during December there were an additional 126 defendants whose cases moved from the magistrate courts to the U.S. district courts after an indictment or information was filed. The sections which follow cover both sets of cases and therefore cover all matters filed in district court during December.
Top Ranked Lead Charges
Table 2 shows the top lead charges recorded in the prosecutions of matters filed in U.S. District Court during December 2023 referred by the Drug Enforcement Administration.
Lead Charge Count Rank 1yr ago 5yrs ago 21 USC 841 - Drug Abuse Prevention & Control-Prohibited acts A 284 1 1 1 More 21 USC 846 - Attempt and conspiracy 111 2 2 2 More 18 USC 922 - Firearms; Unlawful acts 7 4 3 3 More 21 USC 959 - Possession, manufacture, or distribution for purpo 4 5 7 14 More 18 USC 2118 - Robberies/burglaries w/controlled substances 2 6 21 24 More 21 USC 963 - Attempt and conspiracy 2 6 8 9 More 18 USC 924 - Firearms; Penalties 1 8 21 12 More 18 USC 1343 - Fraud by wire, radio, or television 1 8 - - More 18 USC 1365 - Tampering with consumer products 1 8 28 - More 18 USC 1960 - Prohibition of illegal money transmitting business 1 8 19 - More 18 USC 2252 - Material involving sexual exploitation of minors 1 8 - 24 More 21 USC 843 - Drug Abuse Prevention & Control-Prohibited acts C 1 8 10 9 More 21 USC 856 - Establishment for manufacturing operations 1 8 15 14 More State or Territory Provision 1 8 - 24 More Table 2. Top Charges Filed
"Drug Abuse Prevention & Control-Prohibited acts A" (Title 21 U.S.C Section 841) was the most frequent recorded lead charge. "Drug Abuse Prevention & Control-Prohibited acts A" (Title 21 U.S.C Section 841) was ranked 1 a year ago, while it was ranked 1 five years ago.
Ranked 2nd in frequency was the lead charge "Attempt and conspiracy" under Title 21 U.S.C Section 846. "Attempt and conspiracy" under Title 21 U.S.C Section 846 was ranked 2 a year ago, while it was ranked 2 five years ago.
Ranked 3rd was "Other US Code Section" under Title U.S.C Section. "Other US Code Section" under Title U.S.C Section was ranked 4 a year ago, while it was ranked 5 five years ago.
Among these top ten lead charges, the one showing the greatest increase in prosecutions — up 100 percent — compared to one year ago was Title 18 U.S.C Section 924 that involves " Firearms; Penalties ". Compared to five years ago, the largest increase — 60 percent — was registered for prosecutions under " Possession, manufacture, or distribution for purpo " (Title 21 U.S.C Section 959 ).
Again among the top ten lead charges, the one showing the sharpest decline in prosecutions compared to one year ago — down 70.4 percent — was " Possession, manufacture, or distribution for purpo " (Title 21 U.S.C Section 959 ). Compared to five years ago, the most significant decline in prosecutions — 60 percent — was for filings where the lead charge was " Establishment for manufacturing operations " (Title 21 U.S.C Section 856 ).
Top Ranked Judicial Districts
In December 2023 the Justice Department's case-by-case records show that the government brought 230.8 prosecutions for every ten million people in the United States.
Understandably, there is great variation in the per capita number of prosecutions that are filed in each of the nation's ninety-four federal judicial districts.
The districts registering the largest number of prosecutions per capita for these matters last month are shown in Table 3. Districts must have at least 5 prosecutions to receive a ranking.
Judicial District Percapita Count Rank 1yr ago 5yrs ago Alaska 3,587 21 1 90 84 More Ark, E 1,611 22 2 14 29 More N Mexico 1,590 28 3 43 12 More Ill, S 1,474 15 4 31 25 More Ken, E 915 17 5 22 23 More Okla, N 874 8 6 23 53 More Texas, S 776 66 7 3 3 More Texas, E 768 28 8 4 4 More Idaho 743 12 9 58 67 More Okla, W 605 11 10 30 79 More Table 3. Top 10 Districts (per ten million people)
The District of Alaska — with 3587 prosecutions as compared with 230.8 prosecutions per ten million population in the United States — was the most active during December 2023.
The Eastern District of Arkansas (Little Rock) ranked 2nd.
District of New Mexico is now ranking 3rd.
Recent entrants to the top 10 list were Eastern District of Arkansas (Little Rock), now ranked 2nd , and Eastern District of Kentucky (Lexington) at 5th In the same order, these districts ranked 14th and 22nd one year ago and 29th and 23rd five years ago.
The federal judicial district which showed the greatest growth in the rate of prosecutions compared to one year ago — 1533.3 percent — was Alaska . This was the same district that had the largest increase — 345.5 percent — when compared with five years ago.
In the last year, the judicial District Court recording the largest drop in the rate of prosecutions — 58.5 percent — was Northern District of Oklahoma (Tulsa). But over the past five years, Southern District of Illinois (East St. Louis) showed the largest drop — 54.3 percent.
Top Ranked District Judges
At any one time, there are about 680 federal District Court judges working in the United States. The judges recorded with the largest number of new crime cases of this type during December 2023 are shown in Table 4.
Judge Count Rank 1yr ago 5yrs ago O'Connor, Reed Charles Texas, N 21 1 2 6 More Miller, Brian Stacy Ark, E 18 2 55 12 More Delgado Hernandez, Pedro Alberto Puer Rico 18 2 64 119 More Mazzant, Amos L. Texas, E 17 4 13 3 More Gleason, Sharon Louise Alaska 13 5 - 537 More Immergut, Karin Johanna Oregon 10 6 161 - More Maze, Corey Landon Ala, N 9 7 269 - More Burgess, Timothy Mark Alaska 8 8 269 297 More Kim, Young B. Ill, N 7 9 - 252 More Johnson, William Paul N Mexico 7 9 161 208 More Table 4. Top Ten Judges
A total of 5 out of the "top ten" judges were in districts which were in the top ten with the largest number of filings per capita, while the remaining 5 judges were from other districts.
Judge Reed Charles O'Connor in the Northern District of Texas (Fort Worth) ranked 1st with 21 defendants in cases. Judge O'Connor appeared in the top ten rankings one year (ranked 2) and five years ago (rank 6).
Judges Brian Stacy Miller in the Eastern District of Arkansas (Little Rock) and Pedro Alberto Delgado Hernandez in the District of Puerto Rico ranked 2nd with 18 defendants in cases.
Report Generated: February 7, 2024