Prosecutions for August 2023
Referring Agency: Drug Enforcement Administration
The latest available data from the Justice Department show that during August 2023 the government reported 770 new prosecutions for these matters. Those cases were referred by the Drug Enforcement Administration. According to the case-by-case information analyzed by the Transactional Records Access Clearinghouse (TRAC), this number is up 24.6 percent over the previous month.
The comparisons of the number of defendants charged are based on case-by-case information obtained by TRAC under the Freedom of Information Act from the Executive Office for United States Attorneys (see Table 1).
When monthly 2023 prosecutions of this type are compared with those of the same period in the previous year, the number of filings was down (-9.1%). Prosecutions over the past year are still much lower than they were five years ago. Overall, the data show that prosecutions of this type are down 24.5 percent from levels reported in 2018.
Figure 1. Monthly Trends in Prosecutions
The decrease from the levels five years ago in prosecutions for these matters is shown more clearly in Figure 1. The vertical bars in Figure 1 represent the number of prosecutions of this type recorded on a month-to-month basis. Where a prosecution was initially filed in U.S. Magistrate Court and then transferred to the U.S. District Court, the magistrate filing date was used since this provides an earlier indicator of actual trends. The superimposed line on the bars plots the six-month moving average so that natural fluctuations are smoothed out. The one and five-year rates of change in Table 1 and in the sections that follow are all based upon this six-month moving average. To view trends year-by-year rather than month-by-month, see TRAC's annual report series for a broader picture.
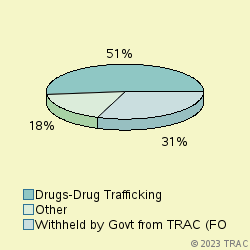
Cases were classified by prosecutors into more specific types.
The largest number of prosecutions of these matters in August 2023 was for "Drugs-Drug Trafficking", accounting for 51.4 percent of prosecutions. Prosecutions were also filed for "Withheld by Govt from TRAC (FOIA challen" (30.8%), "Drugs-Organized Crime Task Force" (14.9%). See Figure 2.
Prosecutions in U.S. Magistrate Courts
Top Ranked Lead Charges
In August 2023, 161 defendants in cases for these matters were filed in U.S. Magistrate Courts. These courts handle less serious misdemeanor cases, including what are called "petty offenses." In addition, complaints are sometimes filed in the magistrate courts before an indictment or information is entered. In these cases, the matter starts in the magistrate courts and later moves to the district court where subsequent proceedings take place.
In the magistrate courts in August the most frequently cited lead charge was Title 21 U.S.C Section 841 involving "Drug Abuse Prevention & Control-Prohibited acts A". This was the lead charge for 52.8 percent of all magistrate filings in August.
Other frequently prosecuted lead charges include: "21 USC 846 - Attempt and conspiracy" (17.4%).
Prosecutions in U.S. District Courts
In August 2023, 609 defendants in new cases for these matters were charged in the U.S. District Courts. In addition during August there were an additional 107 defendants whose cases moved from the magistrate courts to the U.S. district courts after an indictment or information was filed. The sections which follow cover both sets of cases and therefore cover all matters filed in district court during August.
Top Ranked Lead Charges
Table 2 shows the top lead charges recorded in the prosecutions of matters filed in U.S. District Court during August 2023 referred by the Drug Enforcement Administration.
Lead Charge Count Rank 1yr ago 5yrs ago 21 USC 841 - Drug Abuse Prevention & Control-Prohibited acts A 297 1 1 1 More 21 USC 846 - Attempt and conspiracy 175 2 2 2 More 18 USC 922 - Firearms; Unlawful acts 9 4 3 3 More 21 USC 843 - Drug Abuse Prevention & Control-Prohibited acts C 5 5 8 8 More 46 USC 70506 - Penalties 3 6 5 10 More 18 USC 371 - Conspiracy to commit offense or to defraud US 1 7 16 18 More 18 USC 924 - Firearms; Penalties 1 7 22 11 More 18 USC 1040 - Fraud in connection with major disaster or emergency benefits 1 7 - - More 18 USC 1347 - Health Care Fraud 1 7 24 11 More 18 USC 1591 - Sex trafficking of children by force, fraud or coercion 1 7 - - More 18 USC 1960 - Prohibition of illegal money transmitting business 1 7 24 - More 18 USC 2071 - Records & reports- Concealment/removal/mutilation 1 7 - - More 21 USC 844 - Penalty for simple possession 1 7 24 24 More 21 USC 963 - Attempt and conspiracy 1 7 10 7 More Other US Code Section 1 7 24 - More Table 2. Top Charges Filed
"Drug Abuse Prevention & Control-Prohibited acts A" (Title 21 U.S.C Section 841) was the most frequent recorded lead charge. "Drug Abuse Prevention & Control-Prohibited acts A" (Title 21 U.S.C Section 841) was ranked 1 a year ago, while it was ranked 1 five years ago.
Ranked 2nd in frequency was the lead charge "Attempt and conspiracy" under Title 21 U.S.C Section 846. "Attempt and conspiracy" under Title 21 U.S.C Section 846 was ranked 2 a year ago, while it was ranked 2 five years ago.
Ranked 3rd was "Other US Code Section" under Title U.S.C Section. "Other US Code Section" under Title U.S.C Section was ranked 4 a year ago, while it was ranked 9 five years ago.
Among these top ten lead charges, the one showing the greatest increase in prosecutions — up 100 percent — compared to one year ago was Title 21 U.S.C Section 963 that involves " Attempt and conspiracy ". Compared to five years ago, the largest increase — 162.2 percent — was registered for prosecutions under "Other US Code Section " (Title U.S.C Section ).
Again among the top ten lead charges, the one showing the sharpest decline in prosecutions compared to one year ago — down 50 percent — was " Health Care Fraud " (Title 18 U.S.C Section 1347 ). This was the same statute that had the largest decrease — 93.8 % — when compared with five years ago.
Top Ranked Judicial Districts
In August 2023 the Justice Department's case-by-case records show that the government brought 258.9 prosecutions for every ten million people in the United States.
Understandably, there is great variation in the per capita number of prosecutions that are filed in each of the nation's ninety-four federal judicial districts.
The districts registering the largest number of prosecutions per capita for these matters last month are shown in Table 3. Districts must have at least 5 prosecutions to receive a ranking.
Judicial District Percapita Count Rank 1yr ago 5yrs ago S Dakota 3,130 23 1 55 56 More Tenn, W 1,460 19 2 30 53 More Montana 1,304 12 3 70 89 More Alaska 1,198 7 4 92 87 More Ga, N 1,114 66 5 35 38 More N Mexico 1,078 19 6 20 10 More La, W 741 13 7 47 72 More Ark, E 734 10 8 14 34 More Texas, W 721 46 9 4 1 More W Virg, N 650 5 10 76 48 More Table 3. Top 10 Districts (per ten million people)
The District of South Dakota — with 3130 prosecutions as compared with 258.9 prosecutions per ten million population in the United States — was the most active during August 2023.
The Western District of Tennessee (Memphis) ranked 2nd.
District of Montana is now ranking 3rd.
Recent entrants to the top 10 list were Eastern District of Arkansas (Little Rock), now ranked 8th , and New Mexico at 6th In the same order, these districts ranked 14th and 20th one year ago and 34th and 10th five years ago.
The federal judicial district which showed the greatest growth in the rate of prosecutions compared to one year ago — 360 percent — was Alaska . Compared to five years ago, the district with the largest growth — 315.4 percent — was Montana .
In the last year, the judicial District Court recording the largest drop in the rate of prosecutions — 50 percent — was Western District of Tennessee (Memphis). But over the past five years, Western District of Texas (San Antonio) showed the largest drop — 51.9 percent.
Top Ranked District Judges
At any one time, there are about 680 federal District Court judges working in the United States. The judges recorded with the largest number of new crime cases of this type during August 2023 are shown in Table 4.
Judge Count Rank Rodriguez, Xavier Texas, W 19 1 More Polster, Dan A. Ohio, N 18 2 More Bly, Christopher C. Ga, N 16 3 More Parker, Thomas Lee Robinson Tenn, W 16 3 More Gilbert, Jeffrey T. Ill, N 15 5 More Vineyard, Russell G. Ga, N 14 6 More Biery, Samuel Frederick, Jr. Texas, W 14 6 More Saylor, F. Dennis, IV Mass 11 8 More Curiel, Gonzalo Paul Cal, S 9 9 More Russell, George Levi, III Maryland 9 9 More Crane, Randy Texas, S 9 9 More Table 4. Top Ten Judges
A total of 5 out of the "top ten" judges were in districts which were in the top ten with the largest number of filings per capita, while the remaining 6 judges were from other districts. (Because of ties, there were a total of 11 judges in the "top ten" rankings.)
Judge Xavier Rodriguez in the Western District of Texas (San Antonio) ranked 1st with 19 defendants in cases.
Judge Dan A. Polster in the Northern District of Ohio (Cleveland) ranked 2nd with 18 defendants in cases.
Judges Christopher C. Bly in the Northern District of Georgia (Atlanta) and Thomas Lee Robinson Parker in the Western District of Tennessee (Memphis) ranked 3rd with 16 defendants in cases.
Report Generated: October 6, 2023