Prosecutions for June 2020
Referring Agency: Alcohol, Tobacco, Firearms and Explosives
The latest available data from the Justice Department show that during June 2020 the government reported 847 new prosecutions for these matters. Those cases were referred by the Alcohol, Tobacco, Firearms and Explosives. According to the case-by-case information analyzed by the Transactional Records Access Clearinghouse (TRAC), this number is up 133.3 percent over the previous month.
The comparisons of the number of defendants charged are based on case-by-case information obtained by TRAC under the Freedom of Information Act from the Executive Office for United States Attorneys (see Table 1).
When monthly 2020 prosecutions of this type are compared with those of the same period in the previous year, the number of filings was down (-31%). Prosecutions over the past year are still much higher than they were five years ago. Overall, the data show that prosecutions of this type are up 12.8 percent from levels reported in 2015.
The growth in these cases is partly related to increases in the matters filed in U.S. Magistrate Courts. If magistrate cases are excluded and only Federal District Court cases are counted, the overall increase in prosecutions is 3.1 percent instead of 12.8 percent. The evidence suggests that part of the difference may be the result of improvements in the recording of the magistrate cases by the Justice Department.
Figure 1. Monthly Trends in Prosecutions
The increase from the levels five years ago in prosecutions for these matters is shown more clearly in Figure 1. The vertical bars in Figure 1 represent the number of prosecutions of this type recorded on a month-to-month basis. Where a prosecution was initially filed in U.S. Magistrate Court and then transferred to the U.S. District Court, the magistrate filing date was used since this provides an earlier indicator of actual trends. The superimposed line on the bars plots the six-month moving average so that natural fluctuations are smoothed out. The one and five-year rates of change in Table 1 and in the sections that follow are all based upon this six-month moving average. To view trends year-by-year rather than month-by-month, see TRAC's annual report series for a broader picture.
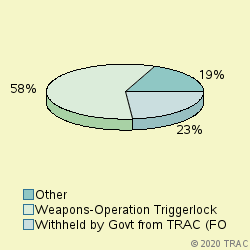
Cases were classified by prosecutors into more specific types.
The largest number of prosecutions of these matters in June 2020 was for "Weapons-Operation Triggerlock Major", accounting for 57.7 percent of prosecutions. Prosecutions were also filed for "Withheld by Govt from TRAC (FOIA challen" (23.5%), "Drugs-Drug Trafficking" (11.3%), "Violence-Other" (4.6%). See Figure 2.
Prosecutions in U.S. Magistrate Courts
Top Ranked Lead Charges
In June 2020, 159 defendants in cases for these matters were filed in U.S. Magistrate Courts. These courts handle less serious misdemeanor cases, including what are called "petty offenses." In addition, complaints are sometimes filed in the magistrate courts before an indictment or information is entered. In these cases, the matter starts in the magistrate courts and later moves to the district court where subsequent proceedings take place.
In the magistrate courts in June the most frequently cited lead charge was Title 18 U.S.C Section 922 involving "Firearms; Unlawful acts". This was the lead charge for 57.2 percent of all magistrate filings in June.
Other frequently prosecuted lead charges include: "21 USC 841 - Drug Abuse Prevention & Control-Prohibited acts A" (6.9%).
Prosecutions in U.S. District Courts
In June 2020, 688 defendants in new cases for these matters were charged in the U.S. District Courts. In addition during June there were an additional 152 defendants whose cases moved from the magistrate courts to the U.S. district courts after an indictment or information was filed. The sections which follow cover both sets of cases and therefore cover all matters filed in district court during June.
Top Ranked Lead Charges
Table 2 shows the top lead charges recorded in the prosecutions of matters filed in U.S. District Court during June 2020 referred by the Alcohol, Tobacco, Firearms and Explosives.
Lead Charge Count Rank 1yr ago 5yrs ago 18 USC 922 - Firearms; Unlawful acts 445 1 1 1 More 21 USC 841 - Drug Abuse Prevention & Control-Prohibited acts A 58 2 2 2 More 21 USC 846 - Attempt and conspiracy 40 3 3 3 More 18 USC 1951 - Hobbs Act 25 4 4 5 More 18 USC 924 - Firearms; Penalties 17 6 6 4 More 18 USC 2119 - Carjacking 9 7 7 10 More 18 USC 371 - Conspiracy to commit offense or to defraud US 8 8 9 7 More 18 USC 844 - Explosives - Importation and storage of explosives 8 8 10 9 More 26 USC 5861 - Tax on Making Firearms - Prohibited acts 7 10 7 6 More Table 2. Top Charges Filed
"Firearms; Unlawful acts" (Title 18 U.S.C Section 922) was the most frequent recorded lead charge. "Firearms; Unlawful acts" (Title 18 U.S.C Section 922) was ranked 1 a year ago, while it was ranked 1 five years ago.
Ranked 2nd in frequency was the lead charge "Drug Abuse Prevention & Control-Prohibited acts A" under Title 21 U.S.C Section 841. "Drug Abuse Prevention & Control-Prohibited acts A" under Title 21 U.S.C Section 841 was ranked 2 a year ago, while it was ranked 2 five years ago.
Ranked 3rd was "Attempt and conspiracy" under Title 21 U.S.C Section 846. "Attempt and conspiracy" under Title 21 U.S.C Section 846 was ranked 3 a year ago, while it was ranked 3 five years ago.
Among these top ten lead charges, the one showing the greatest increase in prosecutions — up 200 percent — compared to one year ago was that involves " ". Compared to five years ago, the largest increase — 2533.3 percent — was registered for prosecutions under "Other US Code Section " (Title U.S.C Section ).
Again among the top ten lead charges, the one showing the sharpest decline in prosecutions compared to one year ago — down 56.9 percent — was " Carjacking " (Title 18 U.S.C Section 2119 ). Compared to five years ago, the most significant decline in prosecutions — 45.3 percent — was for filings where the lead charge was " Firearms; Penalties " (Title 18 U.S.C Section 924 ).
Top Ranked Judicial Districts
In June 2020 the Justice Department's case-by-case records show that the government brought 308.1 prosecutions for every ten million people in the United States.
Understandably, there is great variation in the per capita number of prosecutions that are filed in each of the nation's ninety-four federal judicial districts.
The districts registering the largest number of prosecutions per capita for these matters last month are shown in Table 3. Districts must have at least 5 prosecutions to receive a ranking.
Judicial District Percapita Count Rank 1yr ago 5yrs ago Montana 2,372 21 1 44 44 More Ga, M 1,663 28 2 66 20 More Ark, E 1,537 21 3 18 49 More Ala, S 1,417 10 4 50 27 More S Dakota 1,383 10 5 50 61 More Ala, N 1,247 30 6 6 17 More N Car, W 1,168 32 7 31 24 More Ind, N 1,154 25 8 22 19 More Tenn, W 1,147 15 9 20 17 More N Car, E 1,087 37 10 5 10 More Table 3. Top 10 Districts (per ten million people)
The District of Montana — with 2372 prosecutions as compared with 308.1 prosecutions per ten million population in the United States — was the most active during June 2020.
The Middle District of Georgia (Macon) ranked 2nd.
Eastern District of Arkansas (Little Rock) is now ranking 3rd.
Recent entrants to the top 10 list were Eastern District of Arkansas (Little Rock), now ranked 3rd , and Western District of Tennessee (Memphis) at 9th In the same order, these districts ranked 18th and 20th one year ago and 49th and 17th five years ago.
The federal judicial district which showed the greatest growth in the rate of prosecutions compared to one year ago — 129.6 percent — was Middle District of Georgia (Macon). Compared to five years ago, the district with the largest growth — 217.4 percent — was Eastern District of Arkansas (Little Rock).
In the last year, the judicial District Court recording the largest drop in the rate of prosecutions — 43.4 percent — was Northern District of Alabama (Birmingham). But over the past five years, Southern District of Alabama (Mobile) showed the largest drop — 37.8 percent.
Top Ranked District Judges
At any one time, there are about 680 federal District Court judges working in the United States. The judges recorded with the largest number of new crime cases of this type during June 2020 are shown in Table 4.
Judge Count Rank Hendrix, James Wesley Texas, N 12 1 More Wier, Robert Earl Ken, E 11 2 More Bell, Kenneth Davis, Sr. N Car, W 11 2 More Wimes, Brian Curtis Mo, W 9 4 More Watters, Susan Pamela Montana 9 4 More Whitney, Frank DeArmon N Car, W 9 4 More Nugent, Donald C. Ohio, N 9 4 More Fuentes, Gabriel A. Ill, N 8 8 More Bennett, Alfred Homer Texas, S 8 8 More Axon, Annemarie Carney Ala, N 7 10 More Table 4. Top Ten Judges
A total of 4 out of the "top ten" judges were in districts which were in the top ten with the largest number of filings per capita, while the remaining 6 judges were from other districts.
Judge James Wesley Hendrix in the Northern District of Texas (Fort Worth) ranked 1st with 12 defendants in cases.
Judges Robert Earl Wier in the Eastern District of Kentucky (Lexington) and Kenneth Davis Bell, Sr. in the Western District of North Carolina (Asheville) ranked 2nd with 11 defendants in cases.
Report Generated: July 16, 2020