Convictions for December 2023
Referring Agency: Alcohol, Tobacco, Firearms and Explosives
The latest available data from the Justice Department show that during December 2023 the government reported 659 new convictions for these matters. Those cases were referred by the Alcohol, Tobacco, Firearms and Explosives. According to the case-by-case information analyzed by the Transactional Records Access Clearinghouse (TRAC), this number is up 10 percent over the previous month.
The comparisons of the number of defendants convicted are based on case-by-case information obtained by TRAC under the Freedom of Information Act from the Executive Office for United States Attorneys (see Table 1).
When monthly 2023 convictions of this type are compared with those of the same period in the previous year, the number of convictions was up (12.7%). Convictions over the past year are still much higher than they were five years ago. Overall, the data show that convictions of this type are up 10.9 percent from levels reported in 2018.
Figure 1. Monthly Trends in Convictions
The increase from the levels five years ago in convictions for these matters is shown more clearly in Figure 1. The vertical bars in Figure 1 represent the number of convictions of this type recorded on a month-to-month basis. Where a prosecution was initially filed in U.S. Magistrate Court and then transferred to the U.S. District Court, the magistrate filing date was used since this provides an earlier indicator of actual trends. The superimposed line on the bars plots the six-month moving average so that natural fluctuations are smoothed out. The one and five-year rates of change in Table 1 and in the sections that follow are all based upon this six-month moving average. To view trends year-by-year rather than month-by-month, see TRAC's annual report series for a broader picture.
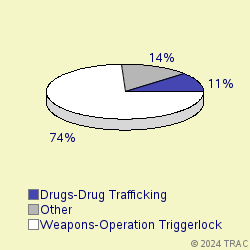
Cases were classified by prosecutors into more specific types.
The largest number of convictions of these matters in December 2023 was for "Weapons-Operation Triggerlock Major", accounting for 74.4 percent of convictions. Convictions were also filed for "Drugs-Drug Trafficking" (11.4%), "Withheld by Govt from TRAC (FOIA challen" (4.7%), "Drugs-Organized Crime Task Force" (4.1%), "Violence-Other" (3.5%). See Figure 2.
Convictions in U.S. Magistrate Courts
Top Ranked Lead Charges
In December 2023, no defendants in cases for these matters were convicted in U.S. Magistrate Courts. These courts handle less serious misdemeanor cases, including what are called "petty offenses." In addition, complaints are sometimes filed in the magistrate courts before an indictment or information is entered. In these cases, the matter starts in the magistrate courts and later moves to the district court where subsequent proceedings take place.
Convictions in U.S. District Courts
In December 2023, 659 defendants in new cases for these matters were charged in the U.S. District Courts. In addition during December there were an additional 0 defendants whose cases moved from the magistrate courts to the U.S. district courts after an indictment or information was filed. The sections which follow cover both sets of cases and therefore cover all matters filed in district court during December.
Top Ranked Lead Charges
Table 2 shows the top lead charges recorded in the convictions of matters filed in U.S. District Court during December 2023 referred by the Alcohol, Tobacco, Firearms and Explosives.
Lead Charge Count Rank 1yr ago 5yrs ago 18 USC 922 - Firearms; Unlawful acts 445 1 1 1 More 21 USC 841 - Drug Abuse Prevention & Control-Prohibited acts A 67 2 2 2 More 21 USC 846 - Attempt and conspiracy 23 3 3 3 More 18 USC 924 - Firearms; Penalties 17 5 6 4 More 18 USC 1951 - Hobbs Act 13 6 5 5 More 26 USC 5861 - Tax on Making Firearms - Prohibited acts 10 7 7 6 More 18 USC 2119 - Carjacking 5 8 9 10 More 18 USC 81 - Arson in special maritime and territorial jurisdic 3 9 19 26 More 18 USC 844 - Explosives - Importation and storage of explosives 3 9 8 8 More Table 2. Top Charges for Convictions
"Firearms; Unlawful acts" (Title 18 U.S.C Section 922) was the most frequent recorded lead charge. "Firearms; Unlawful acts" (Title 18 U.S.C Section 922) was ranked 1 a year ago, while it was ranked 1 five years ago.
Ranked 2nd in frequency was the lead charge "Drug Abuse Prevention & Control-Prohibited acts A" under Title 21 U.S.C Section 841. "Drug Abuse Prevention & Control-Prohibited acts A" under Title 21 U.S.C Section 841 was ranked 2 a year ago, while it was ranked 2 five years ago.
Ranked 3rd were "Other US Code Section" under Title U.S.C Section and "Attempt and conspiracy" under Title 21 U.S.C Section 846. "Other US Code Section" under Title U.S.C Section was ranked 4 a year ago, while it was ranked 7 five years ago."Attempt and conspiracy" under Title 21 U.S.C Section 846 was ranked 3 a year ago, while it was ranked 3 five years ago.
Among these top ten lead charges, the one showing the greatest increase in convictions — up 150 percent — compared to one year ago was Title 18 U.S.C Section 81 that involves " Arson in special maritime and territorial jurisdic ". Compared to five years ago, the largest increase — 300 percent — was registered for convictions under " Carjacking " (Title 18 U.S.C Section 2119 ).
Again among the top ten lead charges, the one showing the sharpest decline in convictions compared to one year ago — down 5.9 percent — was " Explosives - Importation and storage of explosives " (Title 18 U.S.C Section 844 ). Compared to five years ago, the most significant decline in convictions — 37.2 percent — was for convictions where the lead charge was " Attempt and conspiracy " (Title 21 U.S.C Section 846 ).
Top Ranked Judicial Districts
In December 2023 the Justice Department's case-by-case records show that the government obtained 237.3 convictions for every ten million people in the United States.
Understandably, there is great variation in the per capita number of convictions in each of the nation's ninety-four federal judicial districts.
The districts registering the largest number of convictions per capita for these matters last month are shown in Table 3. Districts must have at least 5 convictions to receive a ranking.
Judicial District Percapita Count Rank 1yr ago 5yrs ago Minnesota 1,658 79 1 36 60 More La, E 1,091 15 2 63 85 More Ark, E 1,025 14 3 14 41 More W Virg, S 846 6 4 70 77 More Ala, M 806 8 5 40 48 More Mo, E 783 19 6 4 20 More N Car, M 692 18 7 20 19 More Montana 641 6 8 46 32 More Wash, E 637 9 9 52 57 More Okla, W 605 11 10 47 43 More Table 3. Top 10 Districts (per ten million people)
The District of Minnesota — with 1658 convictions as compared with 237.3 convictions per ten million population in the United States — was the most active during December 2023.
The Eastern District of Louisiana (New Orleans) ranked 2nd.
Eastern District of Arkansas (Little Rock) is now ranking 3rd.
Recent entrants to the top 10 list were Eastern District of Arkansas (Little Rock), now ranked 3rd , and Middle District of North Carolina (Greensboro) at 7th In the same order, these districts ranked 14th and 20th one year ago and 41st and 19th five years ago.
The federal judicial district which showed the greatest growth in the rate of convictions compared to one year ago — 117.8 percent — was Minnesota . This was the same district that had the largest increase — 326.1 percent — when compared with five years ago.
In the last year, the judicial District Court recording the largest drop in the rate of convictions — 49.6 percent — was Eastern District of Missouri (St. Louis). This was the same district that had the largest increase — 10.9 percent — when compared with five years ago.
Top Ranked District Judges
At any one time, there are about 680 federal District Court judges working in the United States. The judges recorded with the largest number of new crime cases resulting in convictions of this type during December 2023 are shown in Table 4.
Judge Count Rank Davis, Michael James Minnesota 13 1 More Frank, Donovan W. Minnesota 9 2 More Ericksen, Joan N. Minnesota 8 3 More Schiltz, Patrick Joseph Minnesota 8 3 More Tostrud, Eric Christian Minnesota 8 3 More Counts, Walter David, III Texas, W 8 3 More Nelson, Susan Richard Minnesota 6 7 More Biggs, Loretta Copeland N Car, M 6 7 More Treadwell, Marc Thomas Ga, M 5 9 More Hall, James Randal Ga, S 5 9 More Montgomery, Ann D. Minnesota 5 9 More Wright, Wilhelmina Marie Minnesota 5 9 More Menendez, Katherine M. Minnesota 5 9 More Ross, John Andrew Mo, E 5 9 More Delgado Hernandez, Pedro Alberto Puer Rico 5 9 More Hendrix, James Wesley Texas, N 5 9 More Urbanski, Michael Francis Virg, W 5 9 More Table 4. Top Ten Judges
A total of 11 out of the "top ten" judges were in districts which were in the top ten with the largest number of convictions per capita, while the remaining 6 judges were from other districts. (Because of ties, there were a total of 17 judges in the "top ten" rankings.)
Judge Michael James Davis in the District of Minnesota ranked 1st with 13 convicted in convictions.
Judge Donovan W. Frank in the District of Minnesota ranked 2nd with 9 convicted in convictions.
Judges Joan N. Ericksen in the District of Minnesota, Patrick Joseph Schiltz in the District of Minnesota, Eric Christian Tostrud in the District of Minnesota and Walter David Counts, III in the Western District of Texas (San Antonio) ranked 3rd with 8 convicted in convictions.
Report Generated: February 7, 2024