Convictions for August 2023
Referring Agency: Alcohol, Tobacco, Firearms and Explosives
The latest available data from the Justice Department show that during August 2023 the government reported 859 new convictions for these matters. Those cases were referred by the Alcohol, Tobacco, Firearms and Explosives. According to the case-by-case information analyzed by the Transactional Records Access Clearinghouse (TRAC), this number is up 16.1 percent over the previous month.
The comparisons of the number of defendants convicted are based on case-by-case information obtained by TRAC under the Freedom of Information Act from the Executive Office for United States Attorneys (see Table 1).
When monthly 2023 convictions of this type are compared with those of the same period in the previous year, the number of convictions was up (2.9%). Convictions over the past year are still much lower than they were five years ago. Overall, the data show that convictions of this type are down 0.3 percent from levels reported in 2018.
Figure 1. Monthly Trends in Convictions
The leveling out from the levels five years ago in convictions for these matters is shown more clearly in Figure 1. The vertical bars in Figure 1 represent the number of convictions of this type recorded on a month-to-month basis. Where a prosecution was initially filed in U.S. Magistrate Court and then transferred to the U.S. District Court, the magistrate filing date was used since this provides an earlier indicator of actual trends. The superimposed line on the bars plots the six-month moving average so that natural fluctuations are smoothed out. The one and five-year rates of change in Table 1 and in the sections that follow are all based upon this six-month moving average. To view trends year-by-year rather than month-by-month, see TRAC's annual report series for a broader picture.
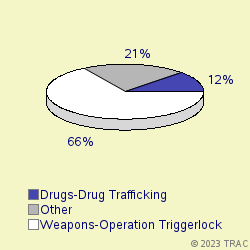
Cases were classified by prosecutors into more specific types.
The largest number of convictions of these matters in August 2023 was for "Weapons-Operation Triggerlock Major", accounting for 66.5 percent of convictions. Convictions were also filed for "Drugs-Drug Trafficking" (12.1%), "Drugs-Organized Crime Task Force" (6.6%), "Withheld by Govt from TRAC (FOIA challen" (6.5%), "Violence-Other" (5.6%). See Figure 2.
Convictions in U.S. Magistrate Courts
Top Ranked Lead Charges
In August 2023, no defendants in cases for these matters were convicted in U.S. Magistrate Courts. These courts handle less serious misdemeanor cases, including what are called "petty offenses." In addition, complaints are sometimes filed in the magistrate courts before an indictment or information is entered. In these cases, the matter starts in the magistrate courts and later moves to the district court where subsequent proceedings take place.
Convictions in U.S. District Courts
In August 2023, 858 defendants in new cases for these matters were charged in the U.S. District Courts. In addition during August there were an additional 0 defendants whose cases moved from the magistrate courts to the U.S. district courts after an indictment or information was filed. The sections which follow cover both sets of cases and therefore cover all matters filed in district court during August.
Top Ranked Lead Charges
Table 2 shows the top lead charges recorded in the convictions of matters filed in U.S. District Court during August 2023 referred by the Alcohol, Tobacco, Firearms and Explosives.
Lead Charge Count Rank 1yr ago 5yrs ago 18 USC 922 - Firearms; Unlawful acts 520 1 1 1 More 21 USC 841 - Drug Abuse Prevention & Control-Prohibited acts A 122 2 2 2 More 18 USC 1951 - Hobbs Act 33 3 5 5 More 21 USC 846 - Attempt and conspiracy 33 3 3 3 More 18 USC 844 - Explosives - Importation and storage of explosives 16 5 8 14 More 18 USC 924 - Firearms; Penalties 15 7 7 4 More 26 USC 5861 - Tax on Making Firearms - Prohibited acts 15 7 6 6 More 18 USC 371 - Conspiracy to commit offense or to defraud US 10 9 10 9 More 18 USC 1959 - Violent crimes in aid of racketeering activity 8 10 11 20 More Table 2. Top Charges for Convictions
"Firearms; Unlawful acts" (Title 18 U.S.C Section 922) was the most frequent recorded lead charge. "Firearms; Unlawful acts" (Title 18 U.S.C Section 922) was ranked 1 a year ago, while it was ranked 1 five years ago.
Ranked 2nd in frequency was the lead charge "Drug Abuse Prevention & Control-Prohibited acts A" under Title 21 U.S.C Section 841. "Drug Abuse Prevention & Control-Prohibited acts A" under Title 21 U.S.C Section 841 was ranked 2 a year ago, while it was ranked 2 five years ago.
Ranked 3rd were "Hobbs Act" under Title 18 U.S.C Section 1951 and "Attempt and conspiracy" under Title 21 U.S.C Section 846. "Hobbs Act" under Title 18 U.S.C Section 1951 was ranked 5 a year ago, while it was ranked 5 five years ago."Attempt and conspiracy" under Title 21 U.S.C Section 846 was ranked 3 a year ago, while it was ranked 3 five years ago.
Among these top ten lead charges, the one showing the greatest increase in convictions — up 117.6 percent — compared to one year ago was Title 18 U.S.C Section 371 that involves " Conspiracy to commit offense or to defraud US ". Compared to five years ago, the largest increase — 362.5 percent — was registered for convictions under " Explosives - Importation and storage of explosives " (Title 18 U.S.C Section 844 ).
Again among the top ten lead charges, the one showing the sharpest decline in convictions compared to one year ago — down 20.1 percent — was " Attempt and conspiracy " (Title 21 U.S.C Section 846 ). This was the same statute that had the largest decrease — 44.5 % — when compared with five years ago.
Top Ranked Judicial Districts
In August 2023 the Justice Department's case-by-case records show that the government obtained 310.2 convictions for every ten million people in the United States.
Understandably, there is great variation in the per capita number of convictions in each of the nation's ninety-four federal judicial districts.
The districts registering the largest number of convictions per capita for these matters last month are shown in Table 3. Districts must have at least 5 convictions to receive a ranking.
Judicial District Percapita Count Rank 1yr ago 5yrs ago Montana 2,717 25 1 28 35 More Alaska 2,567 15 2 73 44 More W Virg, N 2,470 19 3 9 25 More Ala, M 1,314 13 4 42 44 More Ark, E 1,174 16 5 11 49 More S Dakota 1,089 8 6 35 48 More W Virg, S 977 7 7 77 57 More Ala, S 976 7 8 19 59 More Mo, W 961 26 9 13 12 More Tenn, W 922 12 10 35 10 More Table 3. Top 10 Districts (per ten million people)
The District of Montana — with 2717 convictions as compared with 310.2 convictions per ten million population in the United States — was the most active during August 2023.
The District of Alaska ranked 2nd.
Northern District of West Virginia (Wheeling) is now ranking 3rd. The Northern District of West Virginia (Wheeling) was ranked 9 a year ago.
Recent entrants to the top 10 list were Eastern District of Arkansas (Little Rock), now ranked 5th , and Western District of Missouri (Kansas City) at 9th In the same order, these districts ranked 11th and 13th one year ago and 49th and 12th five years ago.
The federal judicial district which showed the greatest growth in the rate of convictions compared to one year ago — 142.9 percent — was Southern District of West Virginia (Charleston). Compared to five years ago, the district with the largest growth — 143.3 percent — was Eastern District of Arkansas (Little Rock).
In the last year, the judicial District Court recording the largest drop in the rate of convictions — 40 percent — was Northern District of West Virginia (Wheeling). But over the past five years, Western District of Tennessee (Memphis) showed the largest drop — 44.7 percent.
Top Ranked District Judges
At any one time, there are about 680 federal District Court judges working in the United States. The judges recorded with the largest number of new crime cases resulting in convictions of this type during August 2023 are shown in Table 4.
Judge Count Rank Nielson, Howard Curtis, Jr. Utah 19 1 More Watters, Susan Pamela Montana 15 2 More Carreño-Coll, Silvia Luisa Puer Rico 12 3 More Gleason, Sharon Louise Alaska 10 4 More Stadtmueller, Joseph Peter Wisc, E 10 4 More Jung, William Frederic Fla, M 9 6 More Pittman, Mark Timothy Texas, N 9 6 More Scriven, Mary Stenson Fla, M 8 8 More Baker, Kristine Gerhard Ark, E 7 9 More Dever, James C., III N Car, E 7 9 More Viken, Jeffrey Lynn S Dakota 7 9 More Garcia Marmolejo, Marina Texas, S 7 9 More Groh, Gina Marie W Virg, N 7 9 More Table 4. Top Ten Judges
A total of 5 out of the "top ten" judges were in districts which were in the top ten with the largest number of convictions per capita, while the remaining 8 judges were from other districts. (Because of ties, there were a total of 13 judges in the "top ten" rankings.)
Judge Howard Curtis Nielson, Jr. in the District of Utah ranked 1st with 19 convicted in convictions.
Judge Susan Pamela Watters in the District of Montana ranked 2nd with 15 convicted in convictions.
Judge Silvia Luisa Carreño-Coll in the District of Puerto Rico ranked 3rd with 12 convicted in convictions.
Report Generated: October 6, 2023