Narcotics/Drugs Prosecutions for February 2024
The latest available data from the Justice Department show that during February 2024 the government reported 1104 new narcotics/drugs prosecutions. According to the case-by-case information analyzed by the Transactional Records Access Clearinghouse (TRAC), this number is up 9.1 percent over the previous month.
The comparisons of the number of defendants charged with narcotics/drugs-related offenses are based on case-by-case information obtained by TRAC under the Freedom of Information Act from the Executive Office for United States Attorneys (see Table 1).
When monthly 2024 prosecutions of this type are compared with those of the same period in the previous year, the number of filings was down (-11.9%). Prosecutions over the past year are still much lower than they were five years ago. Overall, the data show that prosecutions of this type are down 34 percent from levels reported in 2019.
Figure 1. Monthly Trends in Narcotics/Drugs Prosecutions
The decrease from the levels five years ago in narcotics/drugs prosecutions for these matters is shown more clearly in Figure 1. The vertical bars in Figure 1 represent the number of narcotics/drugs prosecutions of this type recorded on a month-to-month basis. Where a prosecution was initially filed in U.S. Magistrate Court and then transferred to the U.S. District Court, the magistrate filing date was used since this provides an earlier indicator of actual trends. The superimposed line on the bars plots the six-month moving average so that natural fluctuations are smoothed out. The one and five-year rates of change in Table 1 and in the sections that follow are all based upon this six-month moving average. To view trends year-by-year rather than month-by-month, see TRAC's annual report series for a broader picture.
Within the broad category of narcotics/drugs, cases were classified by prosecutors into more specific types.
Case types within narcotics/drugs are
Drug Trafficking
Simple Drug Possession
Organized Crime Drug Enforcement Task Force (OCDETF)
Major Project Triggerlock Prosecutions (OCDETF)
Other Triggerlock Prosecutions (OCDETF)
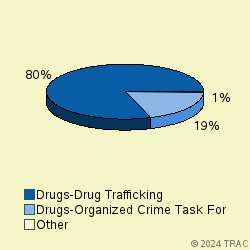
The largest number of prosecutions of these matters in February 2024 was for "Drugs-Drug Trafficking", accounting for 80.3 percent of prosecutions. Prosecutions were also filed for "Drugs-Organized Crime Task Force" (19.1%). See Figure 2.
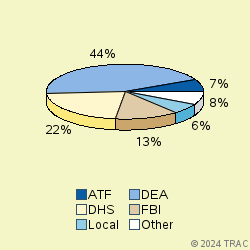
The lead investigative agency for narcotics/drugs prosecutions in February 2024 was DEA accounting for 44 percent of prosecutions referred. Other agencies with substantial numbers of narcotics/drugs referrals were: DHS (22% ), FBI (13%), ATF (7%), Local (6%). See Figure 3.
Narcotics/Drugs Prosecutions in U.S. Magistrate Courts
Top Ranked Lead Charges
In February 2024, 311 defendants in narcotics/drugs cases for these matters were filed in U.S. Magistrate Courts. These courts handle less serious misdemeanor cases, including what are called "petty offenses." In addition, complaints are sometimes filed in the magistrate courts before an indictment or information is entered. In these cases, the matter starts in the magistrate courts and later moves to the district court where subsequent proceedings take place.
In the magistrate courts in February the most frequently cited lead charge was Title 21 U.S.C Section 841 involving "Drug Abuse Prevention & Control-Prohibited acts A". This was the lead charge for 50.2 percent of all magistrate filings in February.
Other frequently prosecuted lead charges include: "21 USC 952 - Importation of controlled substances" (32.8%), "21 USC 846 - Attempt and conspiracy" (11.9%).
Narcotics/Drugs Prosecutions in U.S. District Courts
In February 2024, 793 defendants in new cases for these matters were charged in the U.S. District Courts. In addition during February there were an additional 289 defendants whose cases moved from the magistrate courts to the U.S. district courts after an indictment or information was filed. The sections which follow cover both sets of cases and therefore cover all matters filed in district court during February.
Top Ranked Lead Charges
Table 2 shows the top lead charges recorded in the prosecutions of narcotics/drugs matters filed in U.S. District Court during February 2024.
Lead Charge Count Rank 1yr ago 5yrs ago 21 USC 841 - Drug Abuse Prevention & Control-Prohibited acts A 592 1 1 1 More 21 USC 846 - Attempt and conspiracy 289 2 2 2 More 21 USC 952 - Importation of controlled substances 75 3 3 3 More 18 USC 922 - Firearms; Unlawful acts 36 5 5 4 More 21 USC 843 - Drug Abuse Prevention & Control-Prohibited acts C 6 6 12 11 More 21 USC 963 - Attempt and conspiracy 6 6 8 7 More 21 USC 331 - Fed Food, Drug & Cosmetics Act - Prohibited acts 5 8 28 22 More 46 USC 70503 - Possession control substance on vessel subject to jurisdiction of US 5 8 7 6 More 18 USC 924 - Firearms; Penalties 4 10 16 12 More 18 USC 1791 - Providing or possessing contraband in prison 4 10 12 21 More 21 USC 960 - Prohibited acts A 4 10 32 34 More Table 2. Top Charges Filed
"Drug Abuse Prevention & Control-Prohibited acts A" (Title 21 U.S.C Section 841) was the most frequent recorded lead charge. "Drug Abuse Prevention & Control-Prohibited acts A" (Title 21 U.S.C Section 841) was ranked 1 a year ago, while it was ranked 1 five years ago.
Ranked 2nd in frequency was the lead charge "Attempt and conspiracy" under Title 21 U.S.C Section 846. "Attempt and conspiracy" under Title 21 U.S.C Section 846 was ranked 2 a year ago, while it was ranked 2 five years ago.
Ranked 3rd was "Importation of controlled substances" under Title 21 U.S.C Section 952. "Importation of controlled substances" under Title 21 U.S.C Section 952 was ranked 3 a year ago, while it was ranked 3 five years ago.
Among these top ten lead charges, the one showing the greatest increase in prosecutions — up 250 percent — compared to one year ago was Title 21 U.S.C Section 960 that involves " Prohibited acts A ". This was the same statute that had the largest increase — 250 % — when compared with five years ago.
Again among the top ten lead charges, the one showing the sharpest decline in prosecutions compared to one year ago — down 27.3 percent — was "Other US Code Section " (Title U.S.C Section ). Compared to five years ago, the most significant decline in prosecutions — 59.3 percent — was for filings where the lead charge was " Firearms; Penalties " (Title 18 U.S.C Section 924 ).
Top Ranked Judicial Districts
In February 2024 the Justice Department's case-by-case records show that the government brought 389.6 narcotics/drugs prosecutions for every ten million people in the United States.
Understandably, there is great variation in the per capita number of narcotics/drugs prosecutions that are filed in each of the nation's ninety-four federal judicial districts.
The districts registering the largest number of prosecutions per capita for these matters last month are shown in Table 3. Districts must have at least 5 narcotics/drugs prosecutions to receive a ranking.
Judicial District Percapita Count Rank 1yr ago 5yrs ago W Virg, N 4,154 32 1 8 20 More Cal, S 2,570 74 2 1 1 More Montana 1,710 16 3 27 56 More Miss, N 1,649 15 4 84 86 More Mo, E 1,318 32 5 13 16 More Texas, W 1,168 76 6 2 2 More Idaho 990 16 7 40 46 More Okla, W 990 18 7 24 31 More N Car, E 949 33 9 12 11 More D. C. 893 5 10 65 85 More Table 3. Top 10 Districts (per ten million people)
The Northern District of West Virginia (Wheeling) — with 4154 prosecutions as compared with 389.6 prosecutions per ten million population in the United States — was the most active during February 2024. The Northern District of West Virginia (Wheeling) was ranked 8 a year ago.
The Southern District of California (San Diego) ranked 2nd. The Southern District of California (San Diego) was ranked 1 a year ago, while it was ranked 1 for most frequent use five years ago.
District of Montana is now ranking 3rd.
Recent entrants to the top 10 list were Eastern District of North Carolina (Raleigh), now ranked 9th , and Eastern District of Missouri (St. Louis) at 5th In the same order, these districts ranked 12th and 13th one year ago and 11th and 16th five years ago.
The federal judicial district which showed the greatest growth in the rate of narcotics/drugs prosecutions compared to one year ago — 55.2 percent — was Idaho . Compared to five years ago, the district with the largest growth — 104.2 percent — was Washington, D.C. (Washington).
In the last year, the judicial District Court recording the largest drop in the rate of narcotics/drugs prosecutions — 27.7 percent — was Montana . But over the past five years, Eastern District of North Carolina (Raleigh) showed the largest drop — 44.1 percent.
Top Ranked District Judges
At any one time, there are about 680 federal District Court judges working in the United States. The judges recorded with the largest number of new narcotics/drugs crime cases of this type during February 2024 are shown in Table 4.
Judge Count Rank Hendrix, James Wesley Texas, N 18 1 More Garcia, Orlando Luis Texas, W 17 2 More Jordan, Sean D. Texas, E 14 3 More Brown, Debra Marie Miss, N 12 4 More Ramos, Nelva Gonzales Texas, S 12 4 More Cardone, Kathleen Texas, W 12 4 More Brisbois, Leo I. Minnesota 11 7 More Delgado Hernandez, Pedro Alberto Puer Rico 11 7 More Biery, Samuel Frederick, Jr. Texas, W 11 7 More Larkins, John K., III Ga, N 10 10 More Limbaugh, Stephen Nathaniel, Jr. Mo, E 10 10 More Table 4. Top Ten Judges
A total of 5 out of the "top ten" judges were in districts which were in the top ten with the largest number of narcotics/drugs filings per capita, while the remaining 6 judges were from other districts. (Because of ties, there were a total of 11 judges in the "top ten" rankings.)
Judge James Wesley Hendrix in the Northern District of Texas (Fort Worth) ranked 1st with 18 defendants in narcotics/drugs cases.
Judge Orlando Luis Garcia in the Western District of Texas (San Antonio) ranked 2nd with 17 defendants in narcotics/drugs cases.
Judge Sean D. Jordan in the Eastern District of Texas (Tyler) ranked 3rd with 14 defendants in narcotics/drugs cases.
Report Generated: April 3, 2024