In the just-ended fiscal year, more than three quarters of the tax returns filed by the nation's largest corporations came from financial service organizations — banks, insurance companies, investment advisors, brokerage houses, securities services and the like. And the same group of businesses is credited with controlling 72% of all large-corporation assets, with earning 46% of the net income of all large corporations and reporting 33% of the taxes in this area.
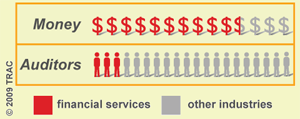
Despite the overwhelming place of the financial services sector in the broader corporate world, however, documents and data obtained by the Transactional Records Access Clearinghouse (TRAC) show that in FY 2008 the IRS allocated only 15% of its overall corporate revenue agents to the agency group that has the lead authority for auditing this complex and now troubled segment of the nation's economy (see Figure 1). Curiously enough, considering the mounting problems now plaguing the financial sector, extremely timely information from the IRS shows that as recently as February 24, IRS managers still were not allocating more auditor time to this special group. TRAC first reported on the disproportionately small allocation of IRS corporate auditors assigned to Financial Services as compared with other industry sectors in 2005. That report covered fiscal years 2001 through the first six months of 2004. This report examines the period since then and shows that if anything, allocations have been cut even further.
Here are the numbers. Overall, the large corporate sector — composed of those firms with $250 million or more in assets — hold 92% of all corporate assets and report 88% of all corporate income taxes. Dominating this large-corporation sector is what IRS calls the "financial services" industry. Currently three out of every four of all large corporate returns — 10,186 out of 13,316 — are filed by the financial services firms (see Table 1).
But according to the IRS documents TRAC obtained under the Freedom of Information Act only 234 of the 1,572 total of staff years allocated during FY 2008 for the audits of all large corporations — 15% of the total — were assigned to the IRS's Financial Services (FS) group.
As shown in Table 2, the FY 2008 allocation is slightly less than it was in 2004 — falling from the small share of only 16% in 2004 to 15% in 2008. This shrinking proportion also can be seen in the decline in the auditor hours the Financial Services group had available to audit the largest corporations — from 269 staff years in 2004 to 234 staff years in 2008. The allocation for 2009 for the FS group remains at 15% for the largest corporations, although it slid another percentage point for the unit as a whole.
During this whole sample period, the dominance of the financial services sector in the economy has been growing, not falling. This is shown by the fact that the proportion of returns filed by large corporations in this sector expanded during the last five years from 71% to 76%, while the actual number of such returns has increased from 7,778 to 10,186 (see Table 3). IRS Failing to Meet Its Stated Goals? In terms of the long history of the IRS, the agency's current organizational relationship with the nation's corporations is relatively new. In 2000, this basic arrangement was radically changed when the agency announced it was abandoning its old district-by-district structure. Instead, the IRS moved to a system where five separate national units with specially trained revenue agents would focus on the very different operations of large and mid-size businesses that fell into five distinct industry sectors. As laid out in the plan, each of the units — organized under an IRS umbrella division coordinating Large and Mid-Size Businesses (LMSB) — would be responsible for the corporations that fit into the new categories, no matter where each business was located in the United States. From that point on, all industries were to be grouped into five broad sectors with specialized units assigned to each. In addition to financial services, the re-organization created four other new nation-wide groups: communications, technology and media; retailers, food, pharmaceuticals and healthcare; natural resources and construction; and heavy manufacturing and transportation. Charles O. Rossotti, then the IRS commissioner, called the agency's 2000 reorganization the most sweeping since 1952. The restructuring, he said, will "ensure uniform and consistent practices" for the corporations and will "lead the IRS to becoming a better, more responsive organization." An IRS report issued at that time said the advantages of the new operating model included "industry-specific knowledge and technical training" that would result in more skilled employees and improvement in both government "response times" and "the ability to identify significant issues earlier in the process." But 2008 data from the IRS — documenting that three quarters of the large corporation tax returns were filed by financial service companies while only 15% of the agency's audit resources were assigned to the Financial Services unit — indicate that the agency's reorganized audit system is not working according to the original plan. And at a time when the whole American economy has slipped into a deep recession — partly because of the widespread failing of the financial services industry — the performance of the IRS in the effective monitoring of business practices is subject to question.
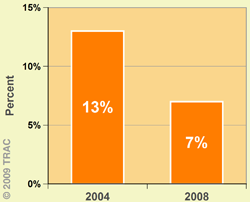
Concerns about the possible failure of the IRS to properly mind the store are heightened by the fact that the IRS has not released any figures on how many audits it actually conducts on these large financial services corporations. Curiously, for an agency that requires citizens to accurately account for the income they receive, the IRS has told TRAC that it does not compile these figures on an industry-by-industry basis and that it thus does not know how many of the financial services companies have been audited. What we do know, however, is that in FY 2004 the audit time assigned to IRS's Financial Services group only permitted it to examine 999 large corporations as compared to the 7,778 returns that were filed by the group. By FY 2008, the resources allocated to the Financial Service group allowed it to audit even fewer firms, while the number of such firms had grown (see Table 4 and Figure 2). The end result was that the relative ratio of audits conducted by this unit to returns filed had dropped from 13% to only 7% last year.
Just how many or how few of the 10,186 large corporate returns filed last year by the financial industry were ultimately audited by any IRS unit is not known. Although IRS corporate auditors assigned to the four other industry groups may have conducted a number of additional audits of financial services companies beyond the meager 7% undertaken by IRS's Financial Services group, the question remains: is using out-of-industry auditors as effective as focusing them on the business areas where they have special knowledge? One thing is clear: the agency's current practice is not consistent with a major objective of the agency's 2000 reorganization plan to establish highly trained cadres of auditors who had developed special expertise in probing the notorious intricacies of the financial services firms. But this agency objective was meant to be applied across the board. The retail industry, the IRS contended, functions in very different ways than heavy manufacturing and the specialized units would improve the effectiveness of the audits for both sectors. So why has the IRS reduced the number of agents assigned to the Financial Services unit if other agents — almost certainly with less in depth knowledge of the area — are being asked to take over part of the workload that the Financial Services auditors were specially trained and equipped to take on?
The IRS for many years has claimed that it audits all of the very biggest of the large corporations, those reporting assets of $20 billion or more. But agency data seem to contradict this assertion, at least when it comes to expert audits of the biggest financial services firms by its trained FS specialists. According to the IRS there were a total of 308 returns filed by these massive financial services businesses in FY 2008. The auditors in the Financial Services unit at IRS, however, report that they were only able to examine the books of 100 of the behemoths. In other words, the FS agents did not have the staff time needed to examine the remaining two-thirds of these firms (see Table 5).
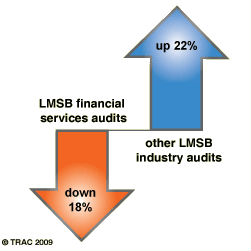
Problems Grow, IRS Response Contracts Looked at over time, even as there were increasing signs of trouble in this area of the economy, the changes in the actual audits and audit hours of large corporations undertaken by the Financial Services group as compared with the remaining industry groups is also surprising. As shown in the Table 6, from FY 2001 to FY 2008 audits by the Financial Service group of large corporations declined by 18% and audit hours slumped by 39%. By contrast, for all the other industry groups in the LMSB, actual audits during the same period increased by 22% and audit hours only showed a slight 8% decline (see Figure 3 and Table 6).
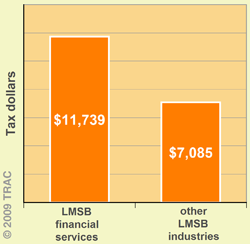
The disproportionate cutbacks in the resources allocated to the Financial Services group have occurred despite the fact that the audits it has completed have in recent years turned up ever higher amounts of tax underreporting than was uncovered by the units assigned to the four other industry groups. As shown in Table 7, from FY 2001 to 2003 the additional taxes recommended by the other industry groups were all about the same — around $3,000 for each auditor hour. However, by FY 2004 the additional taxes recommended by Financial Services teams began to pull ahead of the amounts found by the other industry teams. And by FY 2008, the tax underreporting uncovered by Financial Sector teams amounted to over $11,000 per auditor hour — up 270% over from the beginning of this period. In the same year, this compared to around $7,000 per auditor hour by other industry groups (see Figure 5 and Table 7). Thus the IRS cannot contend that the continued reductions in resources it has given to the Financial Services group was somehow related to the fact that these auditors were less successful than those assigned to the other industries. Indeed, the exact opposite has been true.
The Big Picture Over the years, the IRS has developed into what many view as America's largest and most powerful regulatory agency. This special role is summarized in its sweeping mission statement: "to help the large majority of compliant taxpayers with the tax law, while ensuring that the minority who are unwilling to comply pay their fair share." The information presented in this report asks whether at a time of serious economic troubles the IRS actually has the basic resources and necessary will required to accomplish its mission. Sadly, however, partly because of the refusal of the agency to abide by the 43-year-old FOIA, much of the information the public needs to answer this critical question is not available. |
||||||||||||||||||||||||||||||||||||||||||||||||||||||||||||||||||||||||||||||||||||||||||||||||||||||||||||||||||||||||||||||||||||||||||||||||||||||||||||||||||||||||||||||||||||||||||||||||||||||||||||||||||||||||||||||||||||||||||||||||||||||||||||||||||||||||||||||||||||||||||||||||||||||||||||||||||||||||||||||||||||||||||