Fiscal 2008 Saw Decline in IRS Prosecutions Along Southern Border
The latest available data from the Justice Department show that during fiscal 2008, the government reported 74 new cases referred by the IRS in the five Federal Judicial districts (Texas South, Texas West, New Mexico, Arizona and California South) which lie along the U.S. border with Mexico. According to case-by-case information analyzed by the Transactional Records Access Clearinghouse (TRAC), this number is down 42.6 percent from fiscal 2001, when there were 129 such prosecutions filed.
In comparison, the total number of prosecutions brought by the IRS nationally in fiscal 2008 was 1,368, an increase of 8.7 percent over the 1,259 such prosecutions reported for fiscal 2001.
|
| ||||||||||||||
|
||||||||||||||
The comparisons of the number of defendants charged with offenses are based on case-by-case information obtained by TRAC under the Freedom of Information Act from the Executive Office for United States Attorneys. (See Table 1)
The trend in criminal prosecutions brought by the IRS in the five southern border districts has been downward since 1991, when a peak of 276 such cases were recorded.
The long term trend in prosecutions for these matters going back to fiscal 1986 is shown more clearly in Figure 1. The vertical bars in Figure 1 represent the number of prosecutions of this type recorded each fiscal year. Each presidential administration is distinguished by the color of the bars.
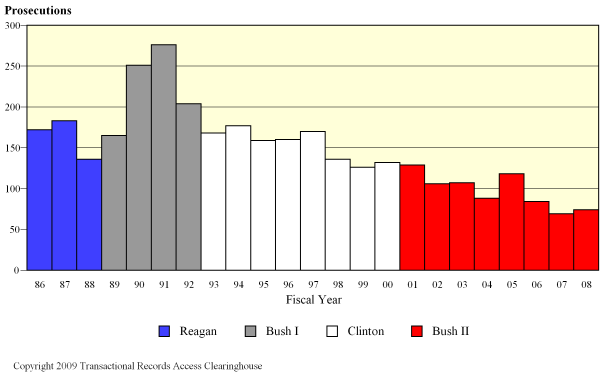 Figure 1: IRS Criminal Prosecutions, Southern Border Districts
Leading Program Areas
Cases were classified by prosecutors into more specific types. In fiscal 2001, the single largest number of prosecutions of these matters was 69 for white collar crime, accounting for 53 percent of prosecutions. The next largest number of matters was 35, filed under the program area of drugs (27 percent).
In fiscal 2008, prosecutions for white collar crime had fallen to 29. While still the area with the single largest number of prosecutions, white collar crime accounted for only 39 percent of IRS prosecutions. Drugs accounted for only 12 prosecutions, down to 16 percent.
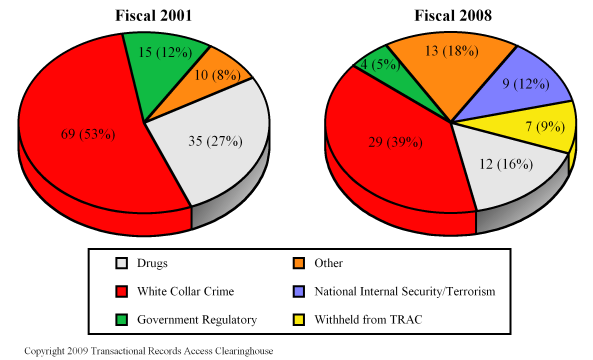 Figure 2: IRS Criminal Prosecutions by Program Area, Southern Border Districts
[In 2008, program area information was withheld by the Department of Justice for 7 cases (9 percent). TRAC, in ongoing litigation, has challenged the government's withholding of program category information, winning a substantial victory in September 2006 decision. The government, however, has filed a notice of appeal which has stayed the order requiring it to release program information.]
Top Ranked Lead Charges
Table 2 shows the top lead charges recorded in the prosecutions of these matters filed in the five Southern Border U.S. District Courts during fiscal 2008. Note: there were an additional 7 other lead charges that were not individually ranked.
| Lead Charge | Fiscal 2008 |
Fiscal 2001 |
||
|---|---|---|---|---|
Count |
Rank | Count |
Rank | |
| 26 USC 7206 - Taxes: Fraud and False statements | 16 | 1 | 31 | 1 |
| 18 USC 1956 - Laundering of monetary instruments | 11 | 2 | 28 | 2 |
| 18 USC 1751 - Presidential and Presidential staff assassination, kidnapping, and assault | 9 | 3 | 0 | - |
| 26 USC 7201 - Attempt to evade or defeat tax | 7 | 4 | 12 | 4 |
| Withheld by govt from TRAC (FOIA challenge pending) | 7 | 4 | 3 | 9 |
| 18 USC 1343 - Fraud by wire, radio, or television | 4 | 6 | 0 | - |
| 18 USC 2314 - Transportation of stolen goods, etc | 3 | 7 | 0 | - |
| 21 USC 0841 - Drug Abuse Prevention + Control-Prohibited acts A | 3 | 7 | 18 | 3 |
| 21 USC 0846 - Drugs: Attempt and conspiracy | 3 | 7 | 5 | 6 |
| 18 USC 0371 - Conspiracy to commit offense or to defraud US | 2 | 10 | 3 | 9 |
| 18 USC 1344 - Bank fraud | 2 | 10 | 0 | - |
Table 2: Top charges filed
"Taxes: Fraud and False statements" (Title 26 U.S.C. section 7206) was the most frequently recorded lead charge. Section 7206 was also ranked first in fiscal 2001.
Ranked second in frequency was the lead charge "Laundering of monetary instruments" under Title 18 U.S.C. section 1956. Section 1956 was also ranked second in fiscal 2001.
Ranked third was "Presidential and Presidential staff assassination, kidnapping, and assault" under Title 18 U.S.C Section 1751. Section 1751 was not ranked in fiscal 2001.
Among those lead charges which for which prosecutions were reported in fiscal 2001, all the ranked lead charges show decreases in fiscal 2008. The greatest decrease in prosecutions — down 83 percent — was Title 21 U.S.C. section 841 involving "Drug Abuse Prevention + Control-Prohibited acts A." Section 841 was the third most frequently cited lead charge in fiscal 2001.